Use Grid Journey Statistics
This component compares multiple journeys and creates a custom grid, then the user decides on the columns to be used. This component could be used to compare a series of newsletters and detect evolutions and tendencies in delivery metrics.
When used in a Dashboard type of report, the comparison is made for a fixed list of journeys. When used in a Multi-journey type of report, it is possible to select a complete folder and provide the report for the last "n" number of journeys.
1. Create a custom report and select Type of one of the following: Dashboard, Single Journey or Multi-journey.
2. Drag a component onto the yellow space.
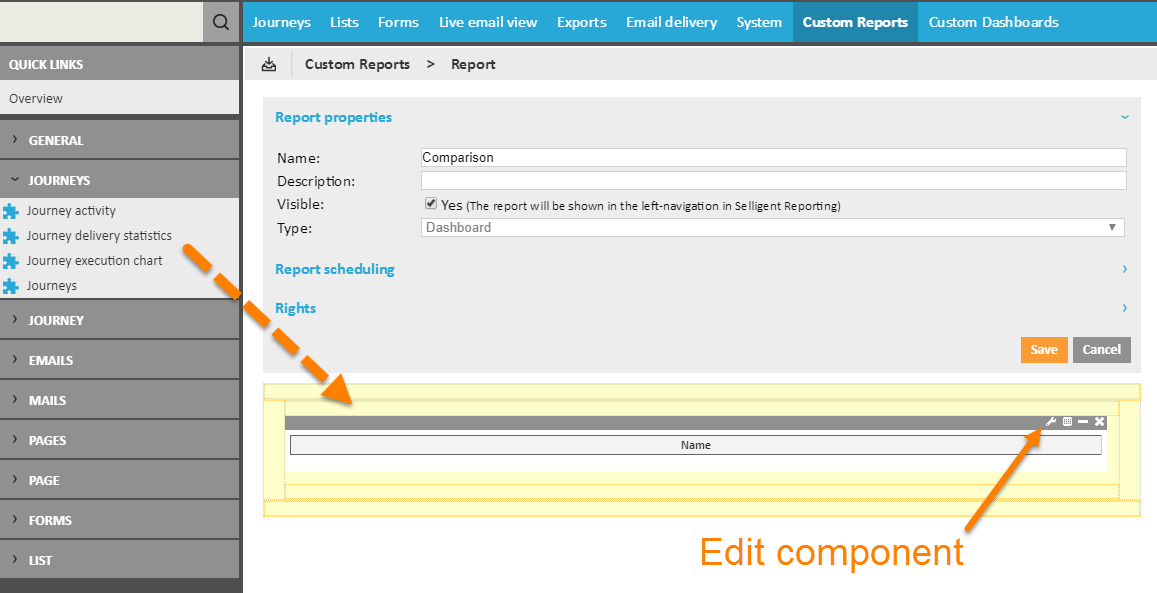
2. Edit the properties of the component by clicking the tool icon in the upper right corner of the component.
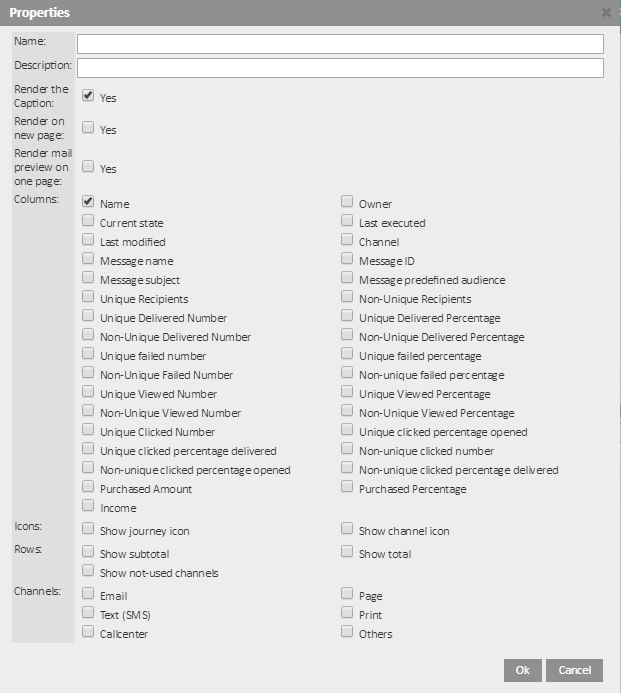
3. Enter a Name and Description for the component.
4. Check the Render the Caption box if the result must include captions.
5. Check the Render on new page box if the result must be displayed on a new page.
4. Select the Columns to include in the comparison report. The columns listed correspond to the different measurements.
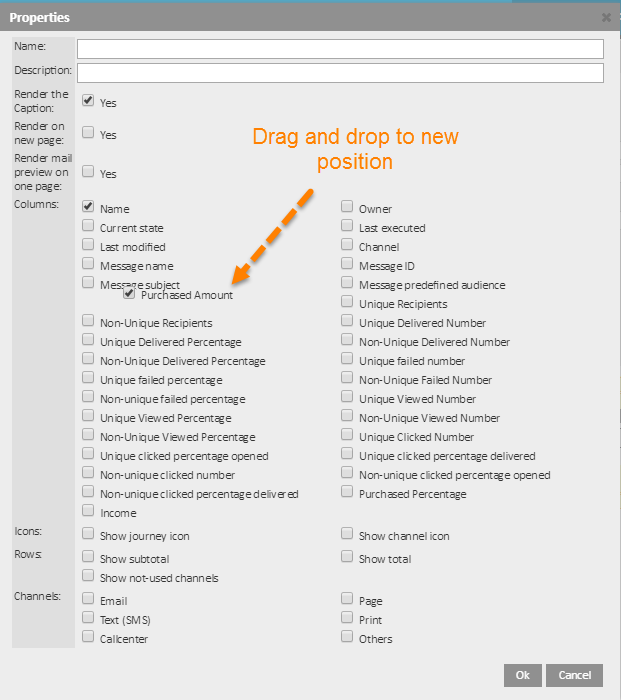
The order of the columns in this configuration page is also the order in which they will be displayed in the report. You can change this through drag-and-drop of a column to the new position.
5. Indicate if Icons should be used in the report for journeys and channels.
6. The Rows in the report contain the different journeys that are compared in the report. The Rows configuration allows indicating if totals, subtotals and not-used channels should be displayed in the report, per journey and for all journeys.
7. Select the Channels that must be included and be sure to include the 'Channels' column in the report.
8. Click OK to save this configuration.
9. Next, the journeys that are to be included need to be selected. Click the 'Edit data' icon in the upper right corner of the component to select them:
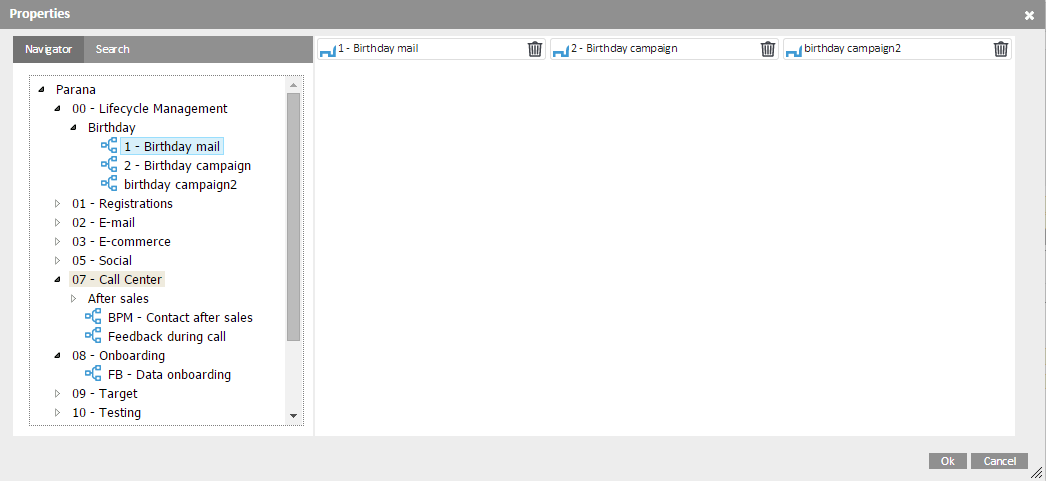
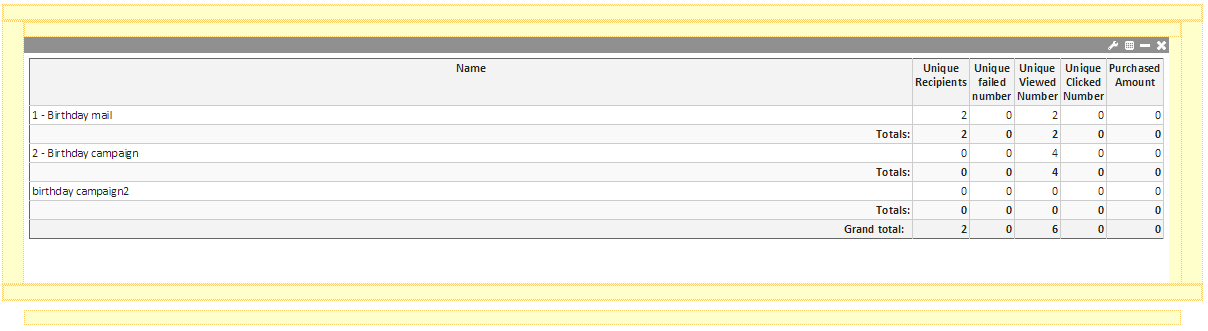
11. When done, click OK. The result is immediately displayed in the component.
12.Be sure to Save the report.
