Use Stored Procedure component
The Stored Procedure component is designed to retrieve information from a Stored Procedure and use that data in the report. Reporting becomes greatly flexible this way.
1. Create a new custom report and add the 'Stored Procedure container' from the general component list.
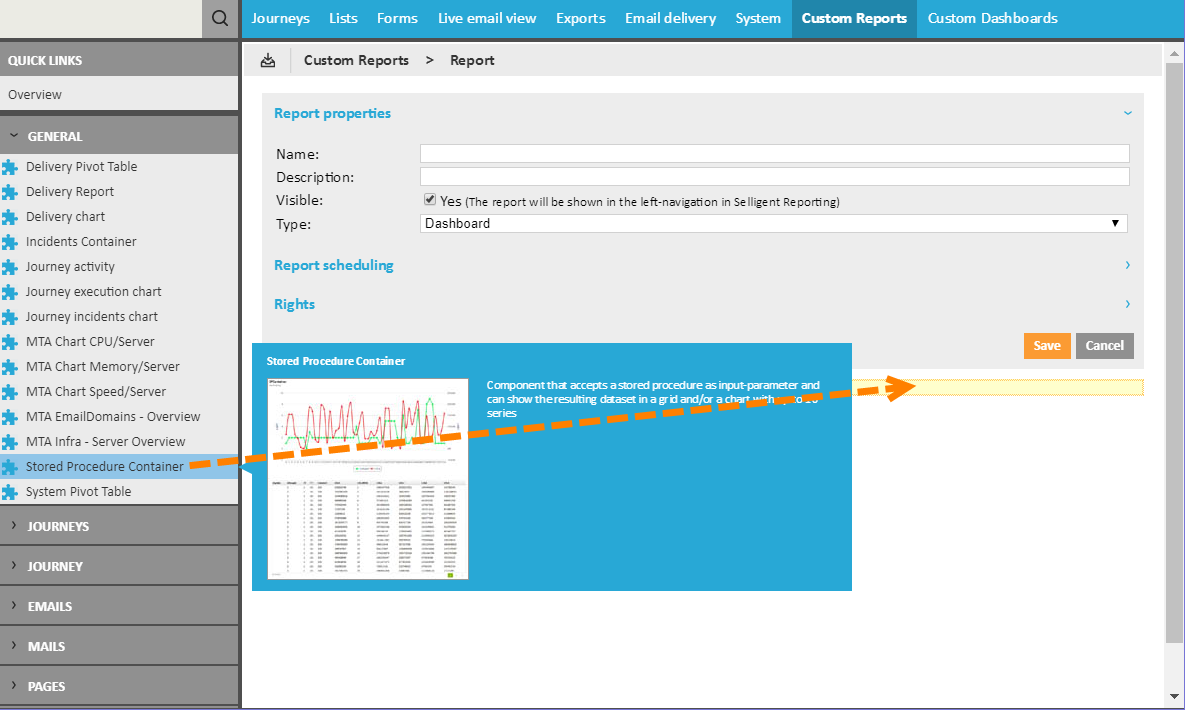
2. Click the icon 'Edit configuration' in the component and start setting the properties:
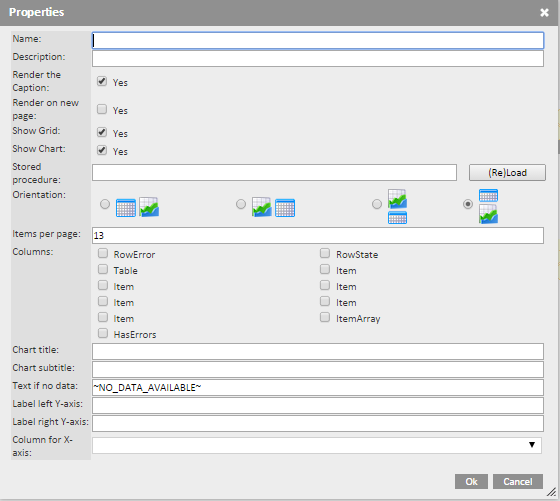
- Name — Enter a descriptive name for the report
- Description — Enter an optional description
- Render the caption — Select if you want a caption on the report.
- Render on new page — Select if you want the report to bring up a new window
- Show grid — Select if the grid must be included
- Show chart — Select if the chart must be included
- Stored Procedure — Enter a name for the Stored Procedure and press 'Load' to
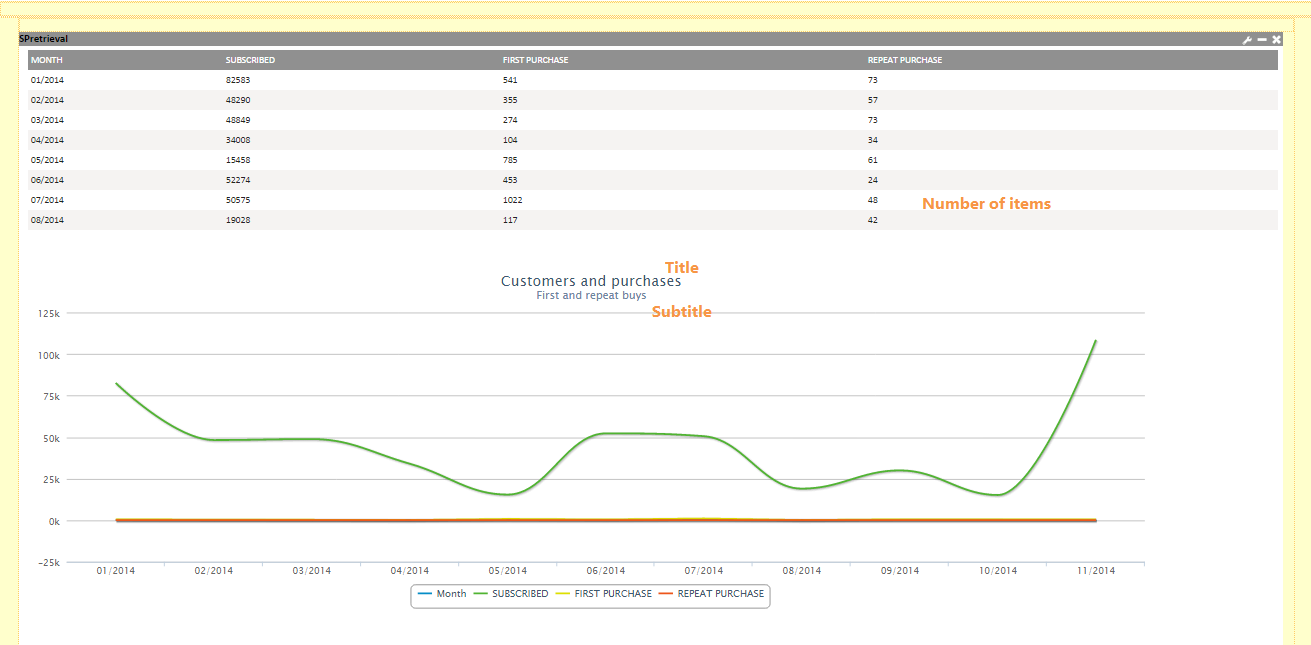
Example: You could create a Stored Procedure Report that retrieves, per month, the number of people subscribed, number of first purchases, and number of repeat purchases.
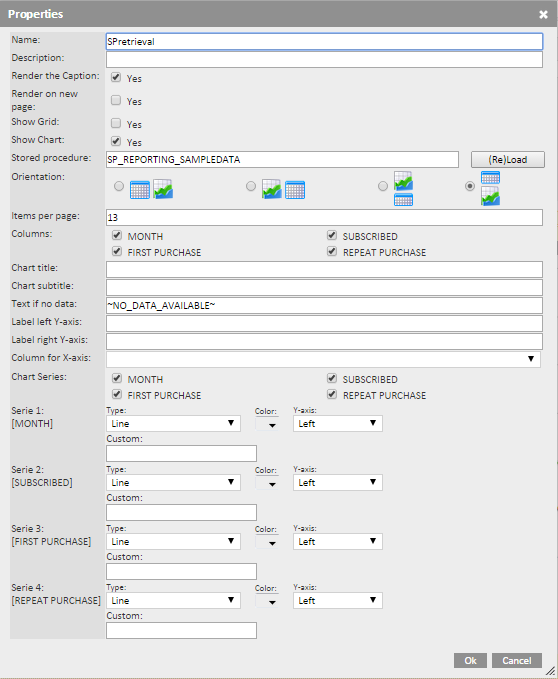
Once the above properties are set, the remainder of the options are available.
- Orientation — Click an option to configure the position of the graph and the table.
- Parameters — If the Stored Procedure accepts parameters, they are listed and can be edited and passed on to the procedure.
- Items per page — Specify the maximum number of records to be displayed in a table.
- Columns — Let's you select columns returned by the Stored Procedure to create chart series from.
- Chart title — Displays the title at the top of the chart
- Chart subtitle — Displays the subtitle just under the title
- Text if no data — Enter what to display when no data is returned by the Stored Procedure.
- Label left Y-axis — Enter the label to display on the Y-axis of the grid
- Label right Y-axis — Enter the label to display on the X-axis of the grid
- Column for X-axis — Enter which column display on the X-axis of the grid
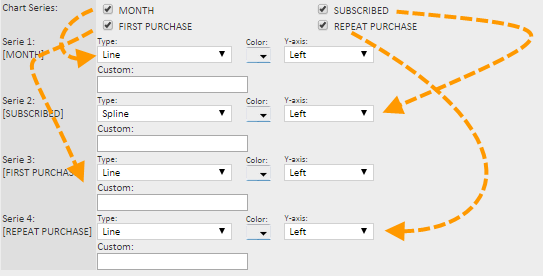
- Chart series — Use this to create a different chart series per column. Select a column to add a series and set the properties for that series, such as type of chart, color and reference axis.
3. Validate the configuration and save the report.