On the Lists screen, the dashboard displays all data source lists. All reports on all lists are grouped in this entry, from Audience list to Taxonomy list.
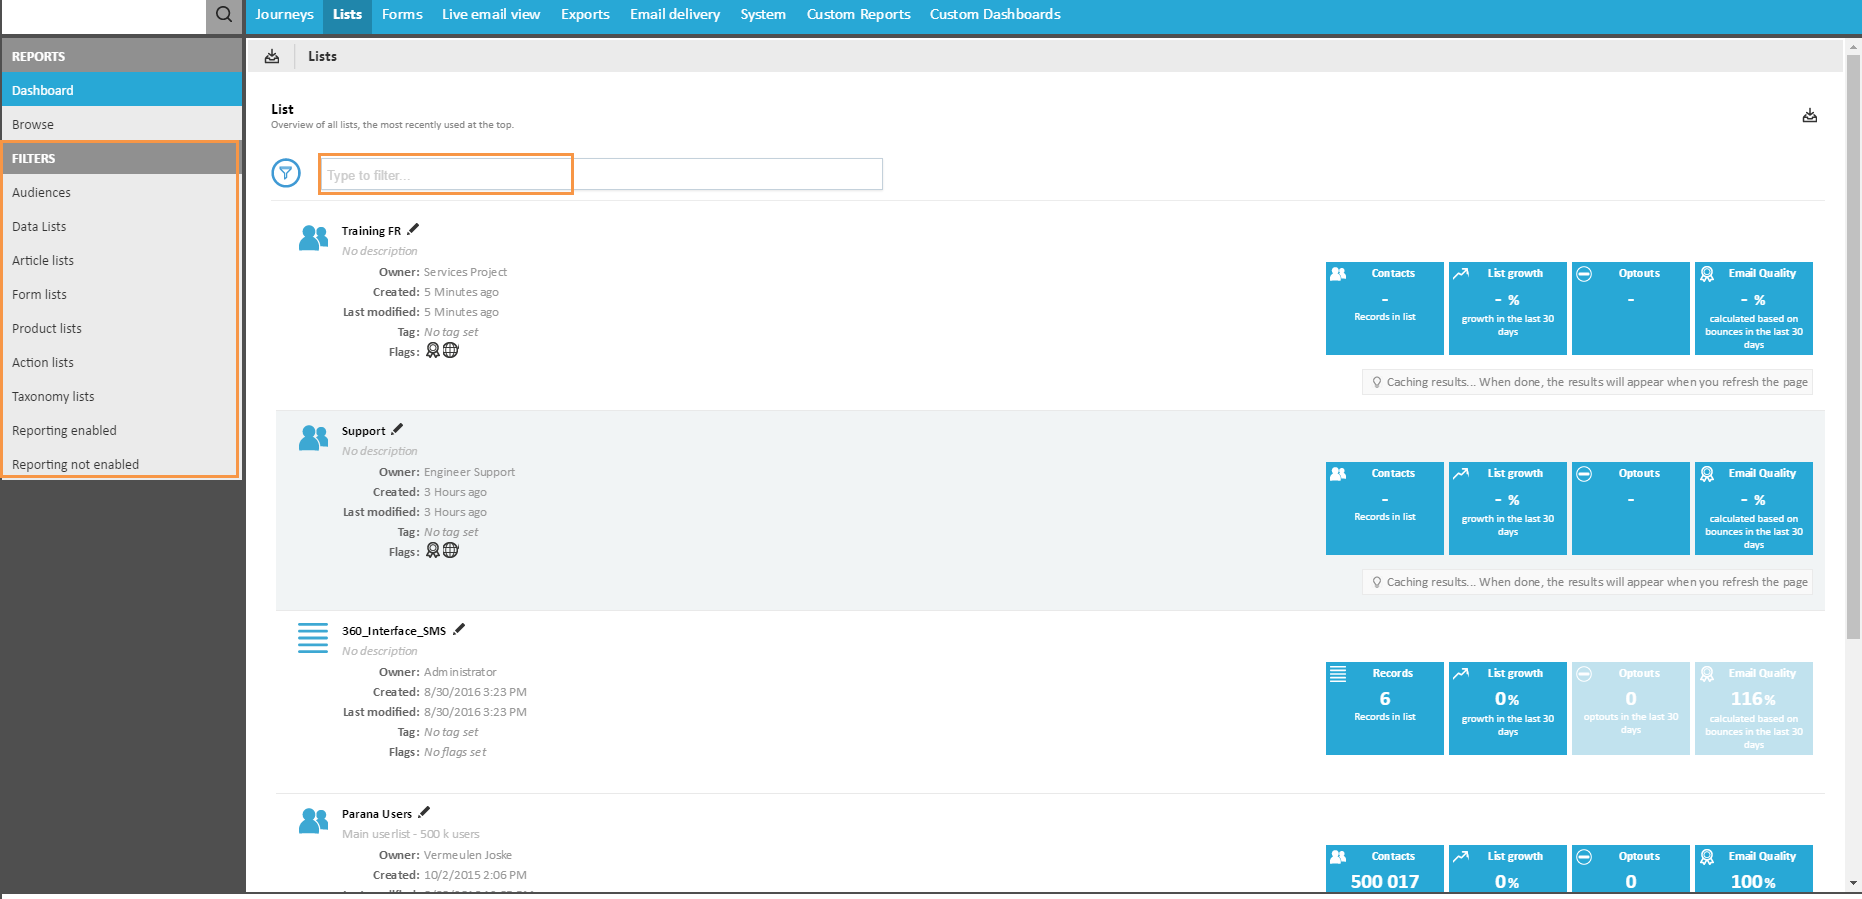
Use the 'Filter' field to narrow down the result. For every list general information is provided. Besides creation and modification dates, category and tags, you'll also find an indication of activated options, such as taxonomy, profile enrichment, email quality, language set, segment selection required, etc.
Important KPI (number of records in the list, list growth, optouts, email quality) are available as well. When KPI's are not activated for a list they are greyed out.
The tree on the left provides following:
- Dashboard — Provides an overview of all lists, with the most recent ones at the top
- Browse — Lets you search for a list in the folder structure. Graphs display the distribution over the different types of lists.
- Filters — Let you filter the data available per type of list: audiences, data lists, articles lists, etc. to create a subset of the data from the list to target.
View the reporting of a specific list by clicking it.
