A Pivot component gives the user the ability to create pivot tables.
A pivot table is a feature that allows data tables to be re-arranged in many ways, with the goal of seeing different views of the same data. A standard grid only contains two dimensions. With a Pivot table, one can define as many dimensions as required.
This option is available within the context of a List and also for Email delivery and System data.
A pivot table allows the user to select dimensions for the rows and columns of the table, as well as the measures that need to be represented in that table. The dimensions and measures proposed depend on the context: a pivot table can be linked to a specific list or be generic and thus be used for other lists as well.
When a pivot table is generic, it is possible that the dimensions configured in the pivot table do not exist for the selected list. In that case, these redundant dimensions are removed from the pivot table.
The Pivot component is configured within the respective chapter and can later on be selected on the ‘Custom report’ tab to place it in a custom report.
Clicking the Pivot entry on the left displays the following screen:
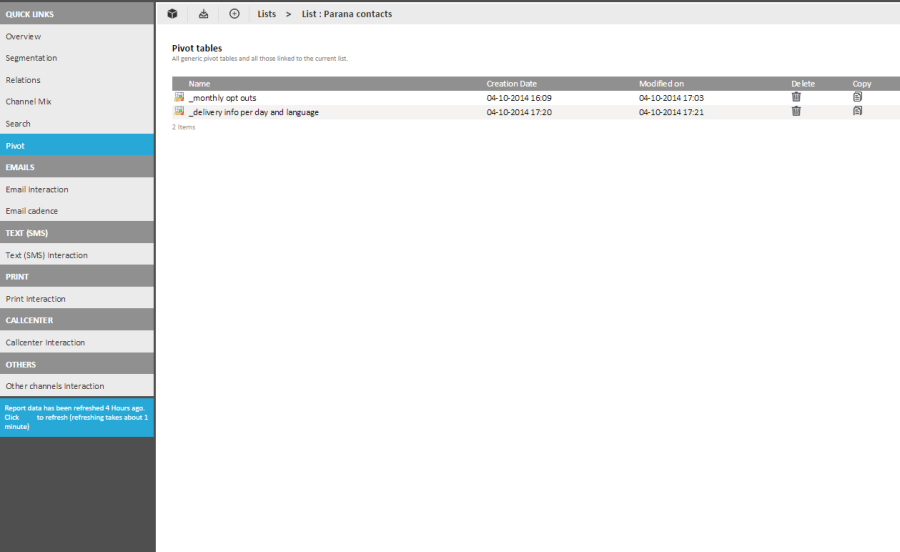
The grid displays all Pivot definitions linked to the current selected list and all generic pivot tables. These can be deleted directly from within the grid, or copied to create a new definition.
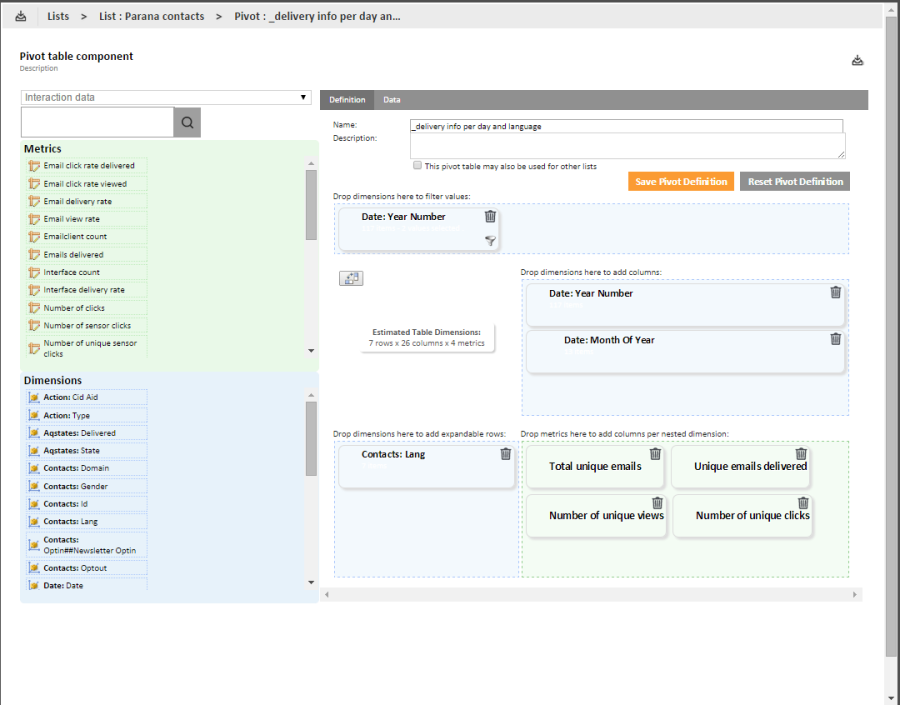
Clicking an existing pivot definition, displays the corresponding configuration pane. (We go more into detail further on):
When a pivot table is viewed for a list that has not the selected dimensions (fields), a warning is displayed saying that all non-existing dimensions will be removed and that the user has the possibility to save this new pivot table under a new name.
Create a Pivot table:
A pivot table is always created starting from a list.
NOTE: this does not mean that the pivot table cannot be used for other lists as well. You need to start from a list because you need access to the building blocks for the pivot table. You can decide if the pivot table is only used for this list or also for other lists.
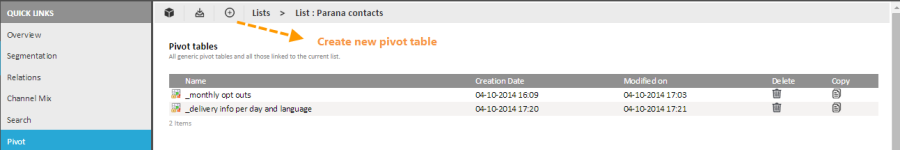
1. From a selected list, select the'Pivot'entry in the tree. All generic pivot tables and pivot definitions created for the selected list are displayed.
2. At the top, in the bread crumb, click the + icon to create a new pivot table:
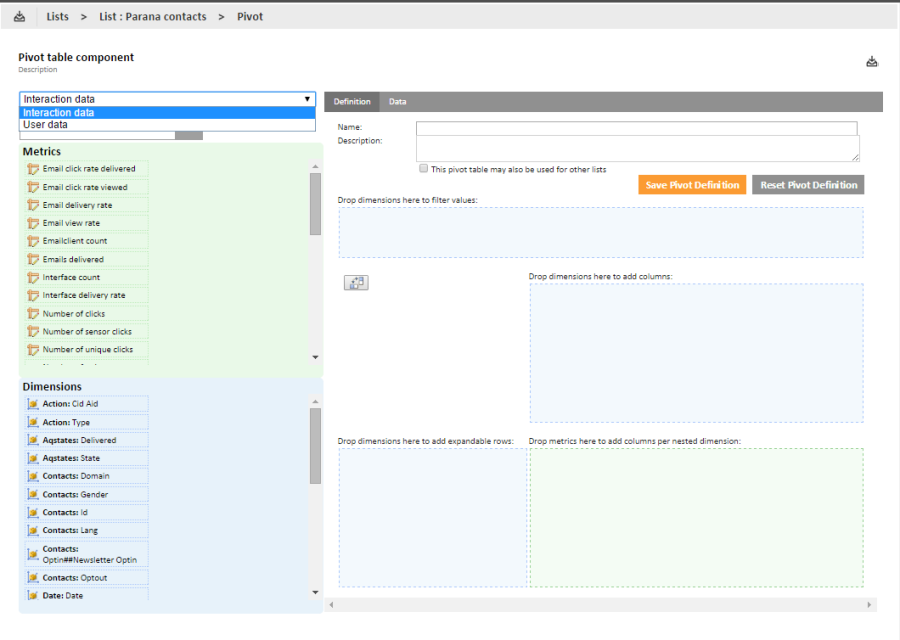
The configuration page is displayed.
3. Start by selecting the type of data that should be used: user data or interaction data. The selected type has an impact on the dimensions and metrics.
- user data: data from the audience list
- interaction data: interaction with an email, form, page
NOTE: Only one metric is available for the type 'user data': User count.
Once the type is selected, the metrics and dimensions on the left are adapted.
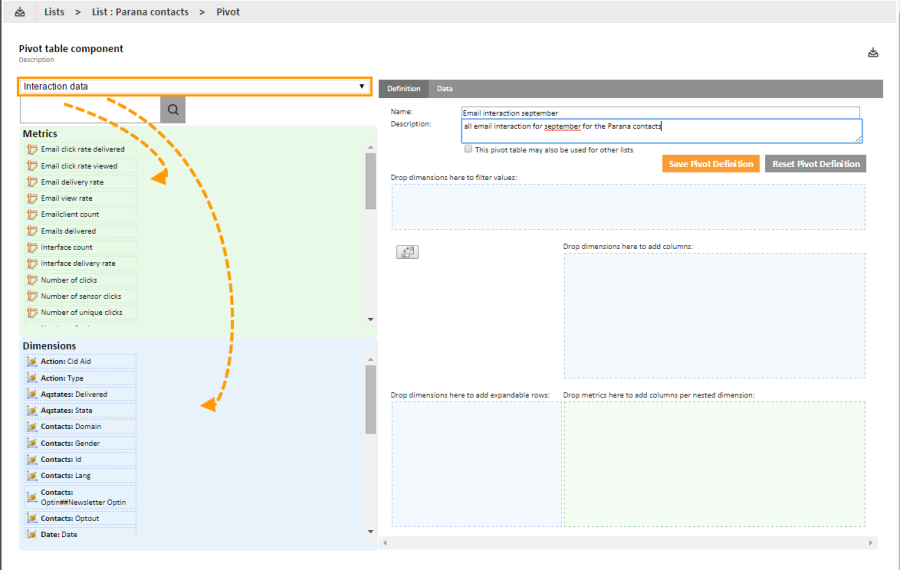
4. Set a name and description.
The check box ‘This pivot table may be used for other lists’ allows the user to render the pivot table also available to other lists. If the option is not flagged, the pivot table can only be used for the current selected list. Additionally, the pivot table will only be displayed when the corresponding list has been selected.
A remark is in place here. If a pivot table can be used by other lists, it is possible that the dimensions in the table (a dimension is based on a field) do not exist for that list. Selligent will in that case alert the user and remove the redundant dimensions from the definition.
5. Decide if the pivot table is generic or not, and check or uncheck the option.
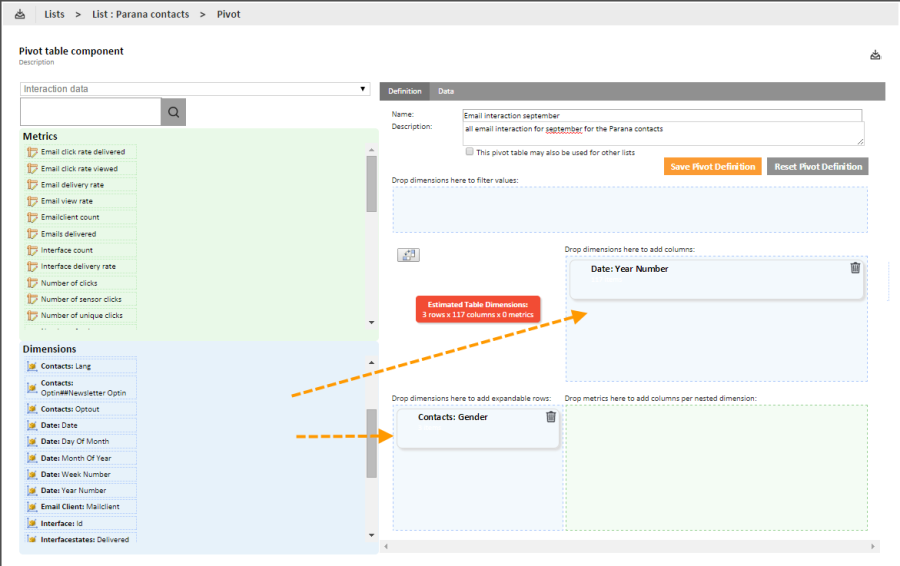
6. Select the dimensions that need to be included in the table. Drag and drop one or more dimensions from the left onto the definition pane. Dimensions can be positioned as a row or a column.
Sensors are available as dimensions for a Pivot table. They are represented by their Probe:Probeid dimension. Two metrics are provided linked to this dimension: number of sensor clicks and number of unique sensor clicks.
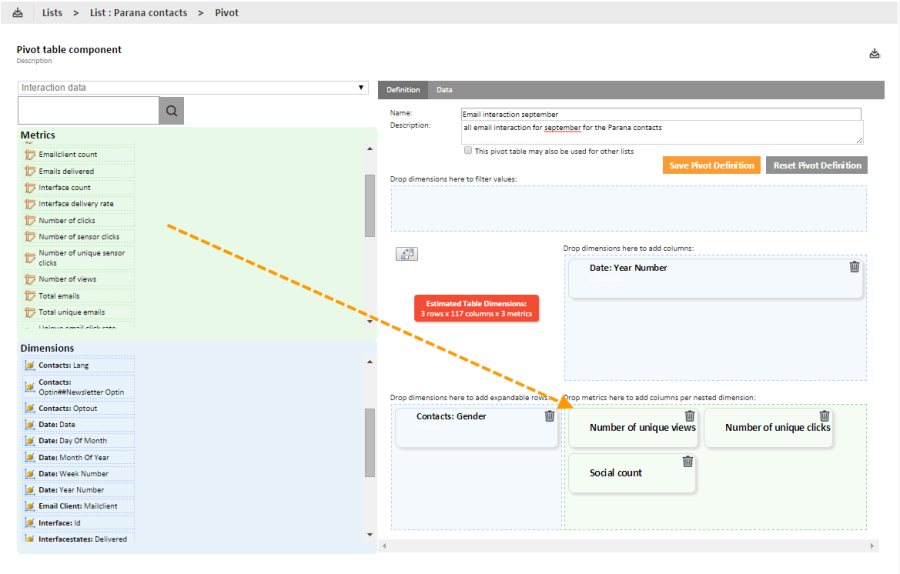
7. Next are the metrics. Drag and drop all required metrics onto the definition page on the right. Metrics are placed as cells in a table.
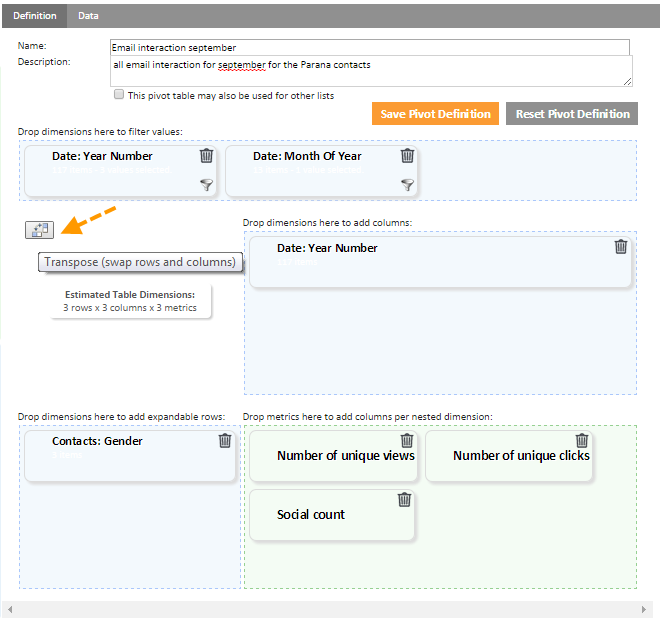
8. last, the filters are set. Dimensions on which a filter must be placed are dragged onto the Filter definition section. (E.g. the Year and Month of Year dimensions are used to limit the numbers to September for the last three years).
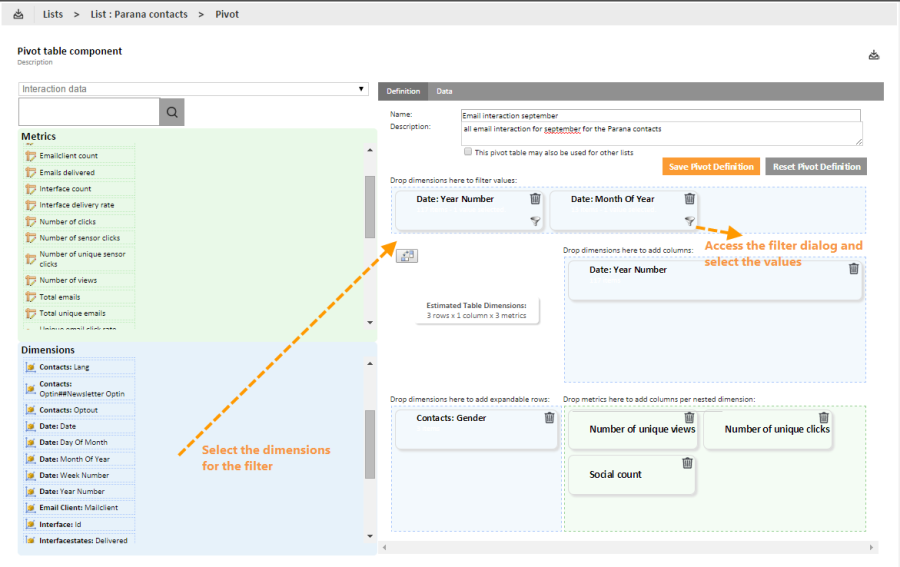
9. To define the filter for a dimension, click the Filter icon. A dialog pops up in which possible values for the dimension are listed.
- A search field limits the values displayed.
- When there are too many values, only a subset is shown. A'More'button jumps to the next set of values.
10. Select the values and press'Apply'. The filter now holds the number of values selected and the number of items that correspond to the filter. Hover the filter to see the selected values.
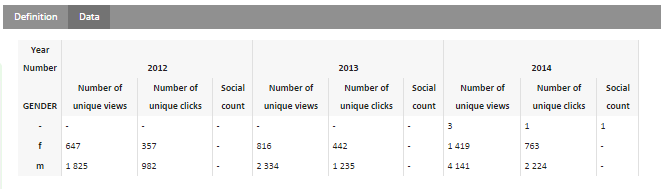
11. Time to save the definition and check out the result on the'Data'tab.
To compare the different years, it might probably be easier to display the year as a rows and the gender as columns. Without having to restart the entire definition, it is possible to swap and inter-change the dimensions between columns and rows. To do so, click the 'Transpose' icon on the definition page.
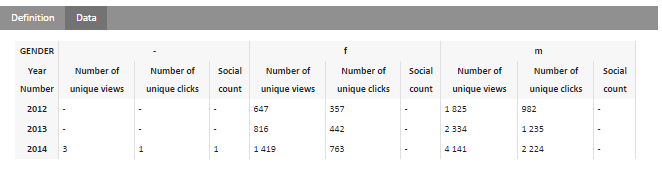
Check again the result. Much clearer now:
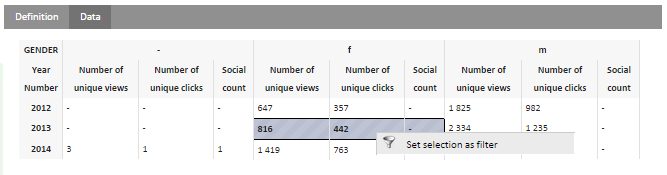
From this result table you can filter the information. Select one or more dimensions by holding the left mouse button and going over the cells. Right click the highlighted section and select 'Set selection as filter'.
A filter cannot be set on one metric; all metrics for the selected dimension are automatically selected.
The 'Data' tab is updated and only displays the selected data and the Pivot table definition includes now also this filter.
