The System report allows follow-up on the use of the whole Selligent environment over the years.
The‘System use’ entry contains a chart showing the evolution of the email delivery since the activation of the system. It’s possible to refine this data by selecting a year and a month using the corresponding drop-down list at the left side of the chart:
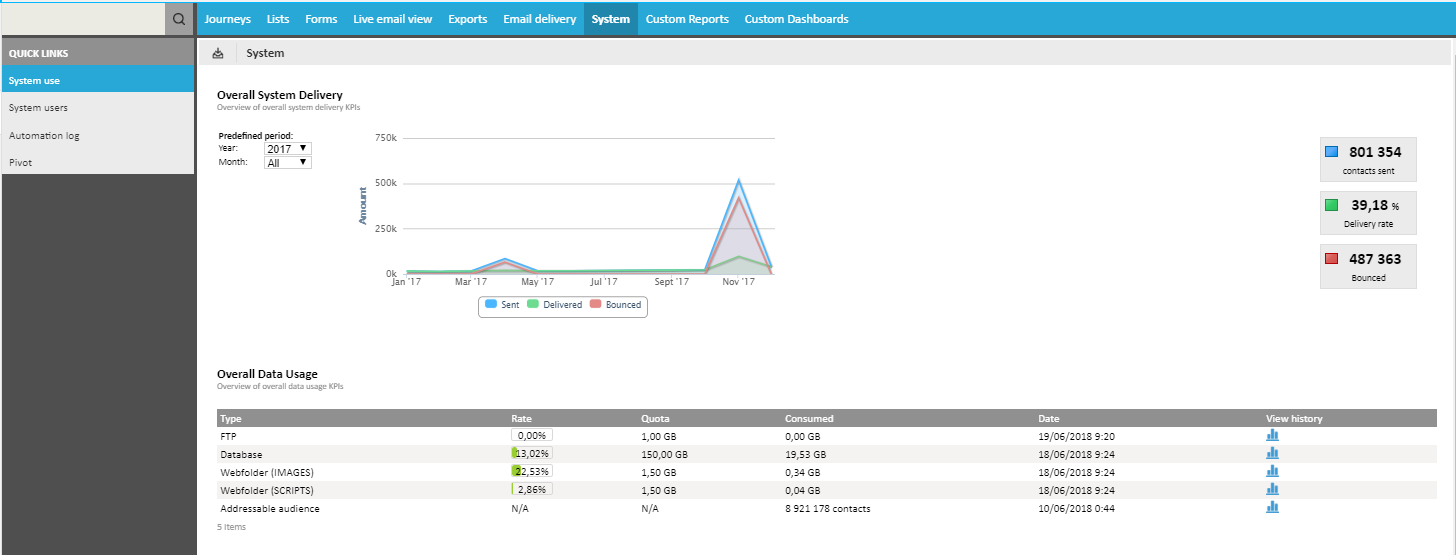
System users represents the total number of users over all user lists. It is calculated on a monthly basis.
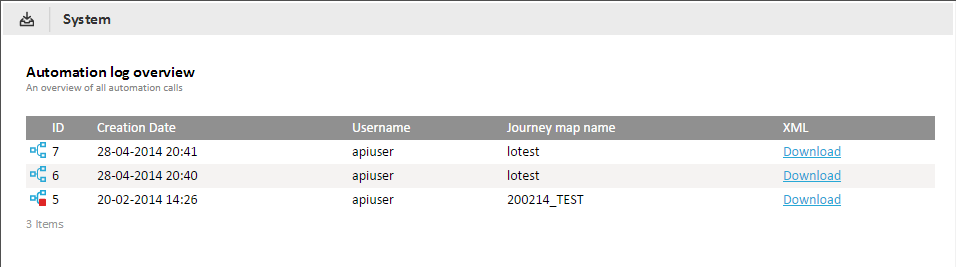
The ‘Automation log’ provides a list of all journeys that have been generated by the broadcast API. The button‘Download’provides the XML that is used to create the journey:
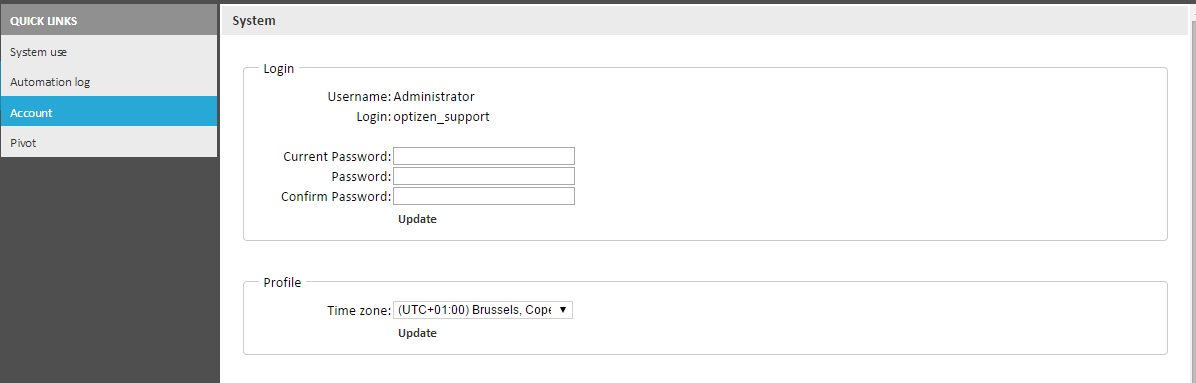
The'Account'entry contains the account information which can be updated from there.
Pivot provides access to the list of existing pivot tables and the option to create new ones. These pivot tables are based on metrics such as Email count, Web sensor count, email delivery rate, etc.
When a shop tracker is defined in the system, metrics for the items sold and revenue are available as well.
