The insights section of Recommendations provides you with precise information and analytics on individual products and visitors. Recommendations monitors the performance of products (visits, clicks, add-to-carts) and finds relationships between products in your catalog (what's visited before/after, what's often bought together) and relationships between products and individual visitors.
In this topic, the sub-sections are described that appear in the "Insights" section of Recommendations:
Product insights
The 'Products' insights page contains a table showing information on products and the way these products are being discovered by visitors.
Note: Only a maximum of 10.000 items are displayed in the overview, with at the top the items with the most interaction.
The top section provides details on how many items are in the catalog, and how many of these are active or deleted. By default, deleted items are not shown.
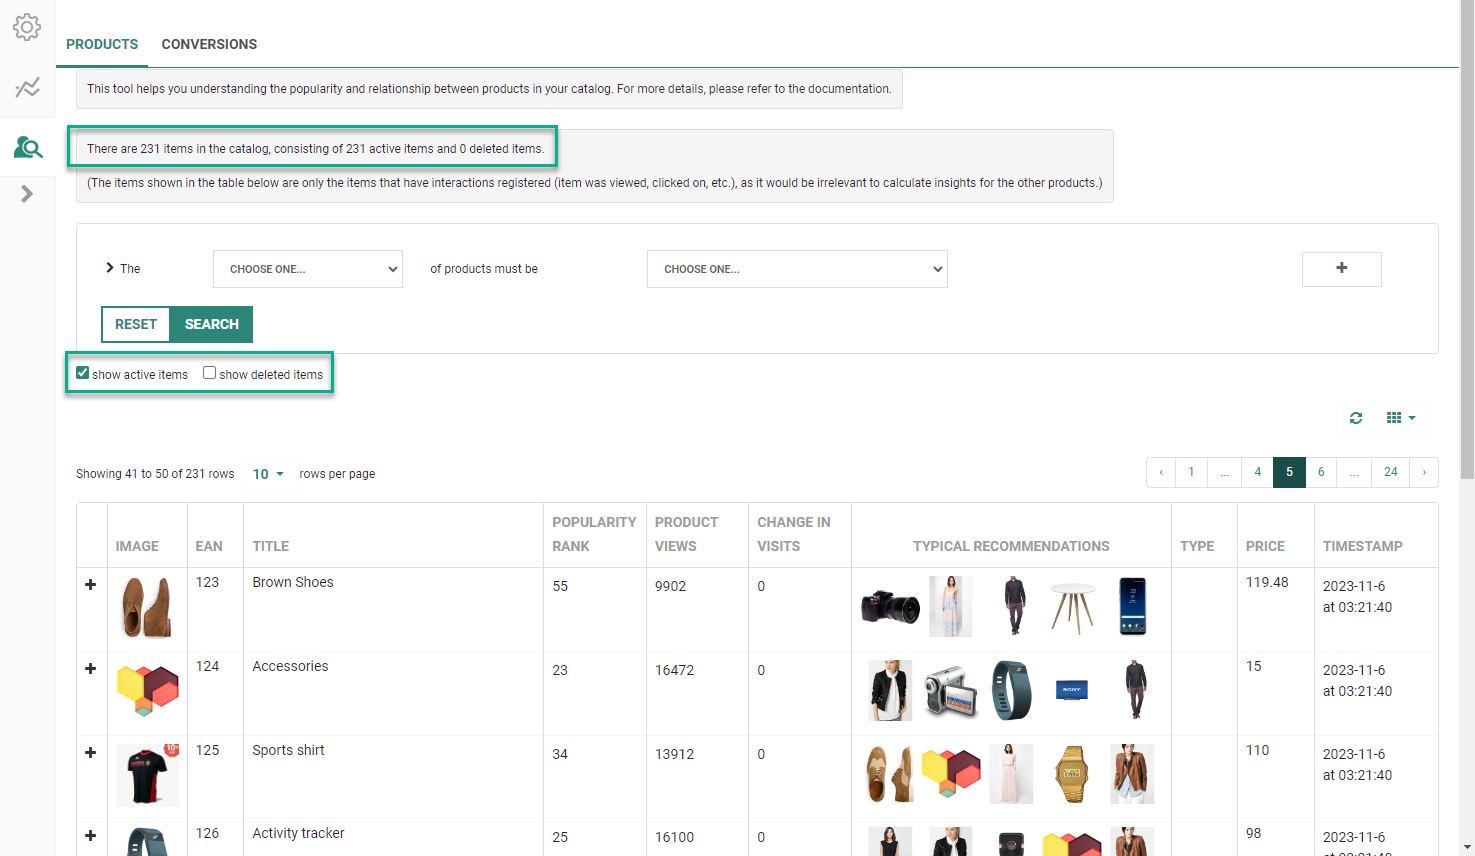
In this table products are sorted by "highest change in visits" week-to-week, in other words: the first products shown are the ones that had the biggest increase in popularity over the last two weeks.
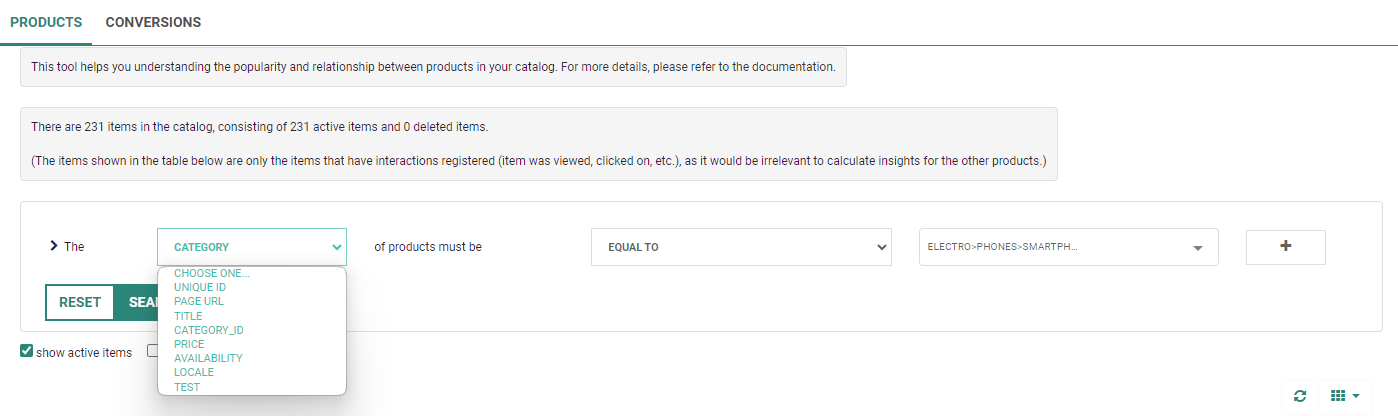
If you want to find a specific product, you can use the search menu which can filter items by specific fields/keywords such as category, availability, item_url, price etc.
Also, you can filter the products to show only the active or deleted ones.
In the table each product contains the following information:
- Image, EAN, title, type and price taken from your product catalog feed.
- Popularity rank represents the popularity of the product measured by the number of visits. The most popular product will have rank 1, the second most popular will have a rank of 2, and so on.
- Product views is the actual number of times this product was viewed over the last months.
- Change in visits is the number by which the number of visits of this product was increased or decreased over the last week compared to the previous week.
- Typical recommendations are the products that Recommendations would present to a visitor if the "recommendations" algorithm is configured and if the visitor has not seen anything else before and lands on this product for the first time.
- Timestamp is the date/time at which the statistics for these product were calculated.
If you click on the '+' sign in front of a product, a detailed view will open under the product, which looks like this:
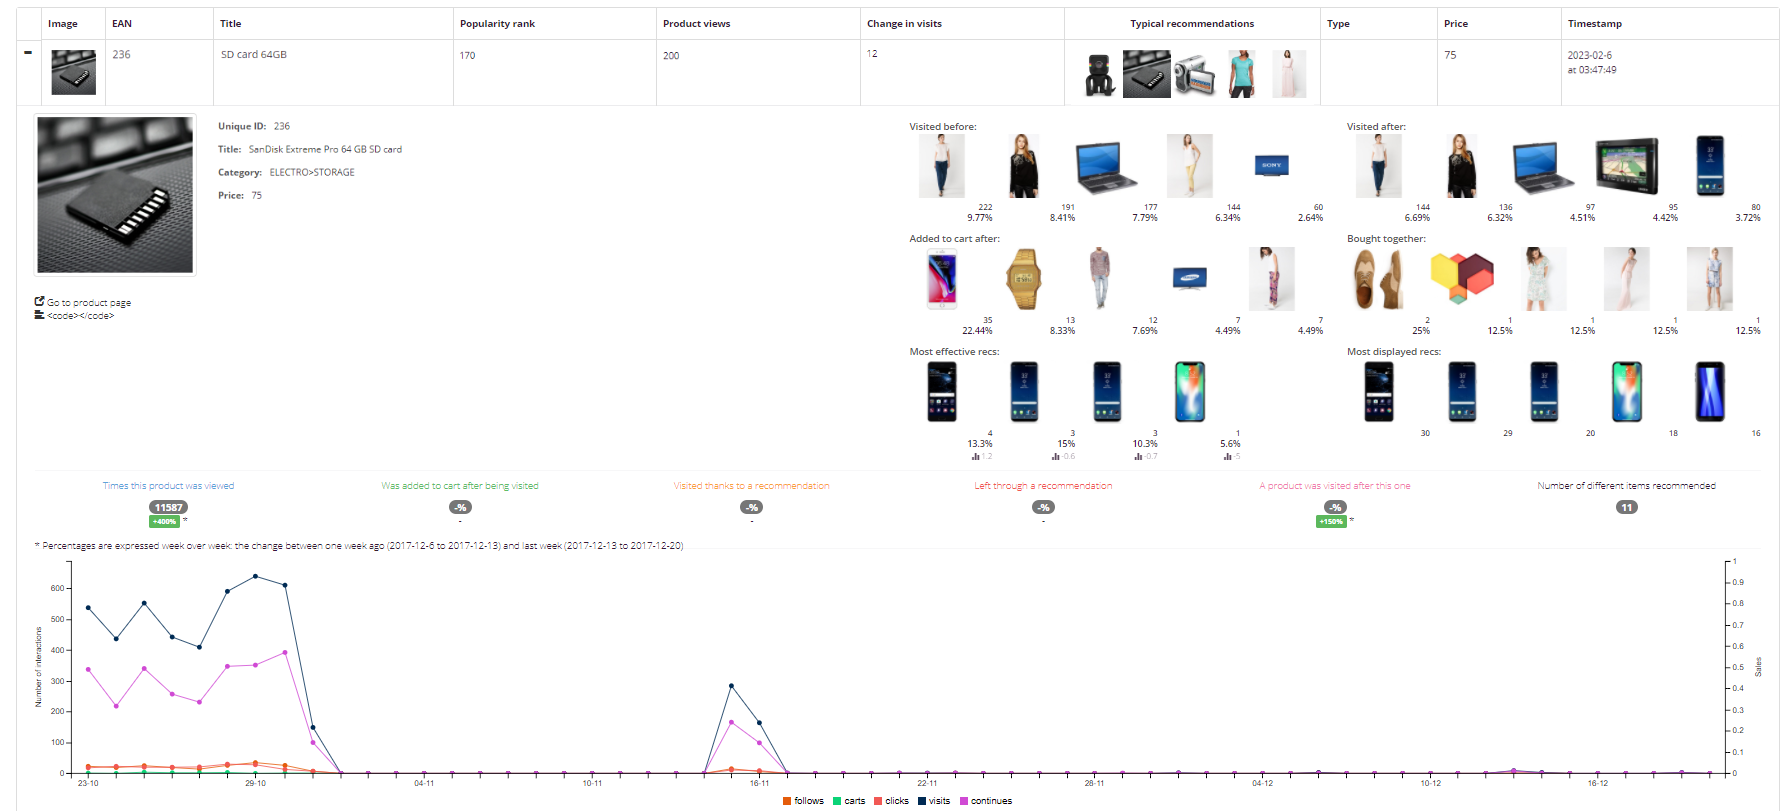
This detailed view contains more information on the specific product you are looking at:
- Visited before — The five products that were visited the most before the current product.
- Visited after — The five products that were visited the most after the current product.
- Added to cart after — The five products that were added to cart the most after this product was visited.
- Bought together — The five products that are often found in the same cart with the current product.
- Most effective recs — The five most effective recommendations on the product page of the current product.
"Most effective recommendations" means: the recommendations that led to the highest number of cart additions. - Most displayed recs — The five most displayed recommendations on the product page of the current product.
Conversion insights
You can monitor the behavior that led to a buying behavior for individual visitors. This helps you understand how visitors browse your website, monitor typical buying behaviors and see how recommendations help the visitor discover new products.
The 'Conversions' insights overview will tell you if a click on a Smart Content has led to an add-to-cart action or even to a purchase action. The Smart Content responsible for the conversion is visible from the overview.
The menu allows you to pick conversions in a range between certain days.
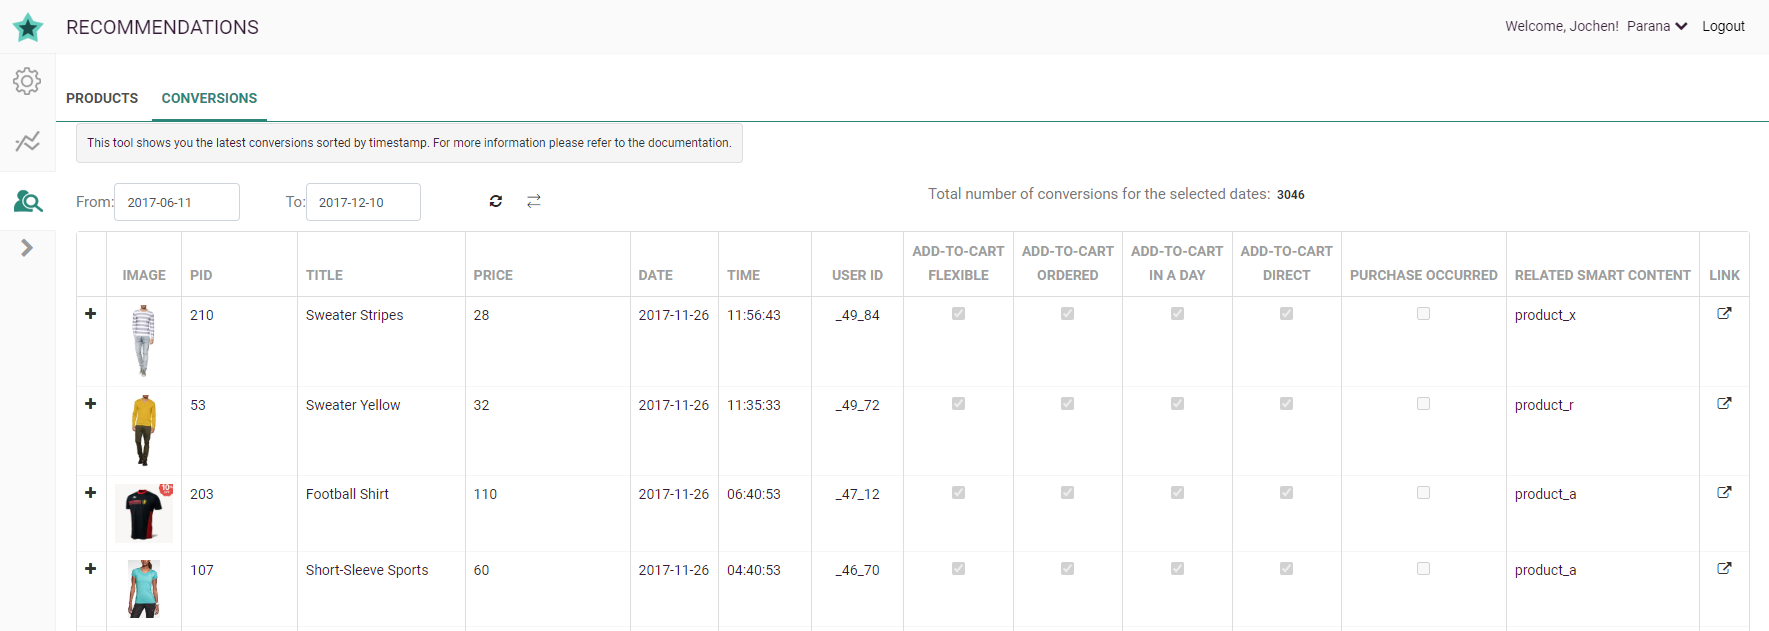
It's possible that when you first land on the page, you don't see the table containing the conversions. This can happen if you don't have any conversions on the day which is displayed, or if the data has not been calculated yet by Recommendations.
If you click on the '+' sign in front of a product, the complete journey of the consumer will be displayed:
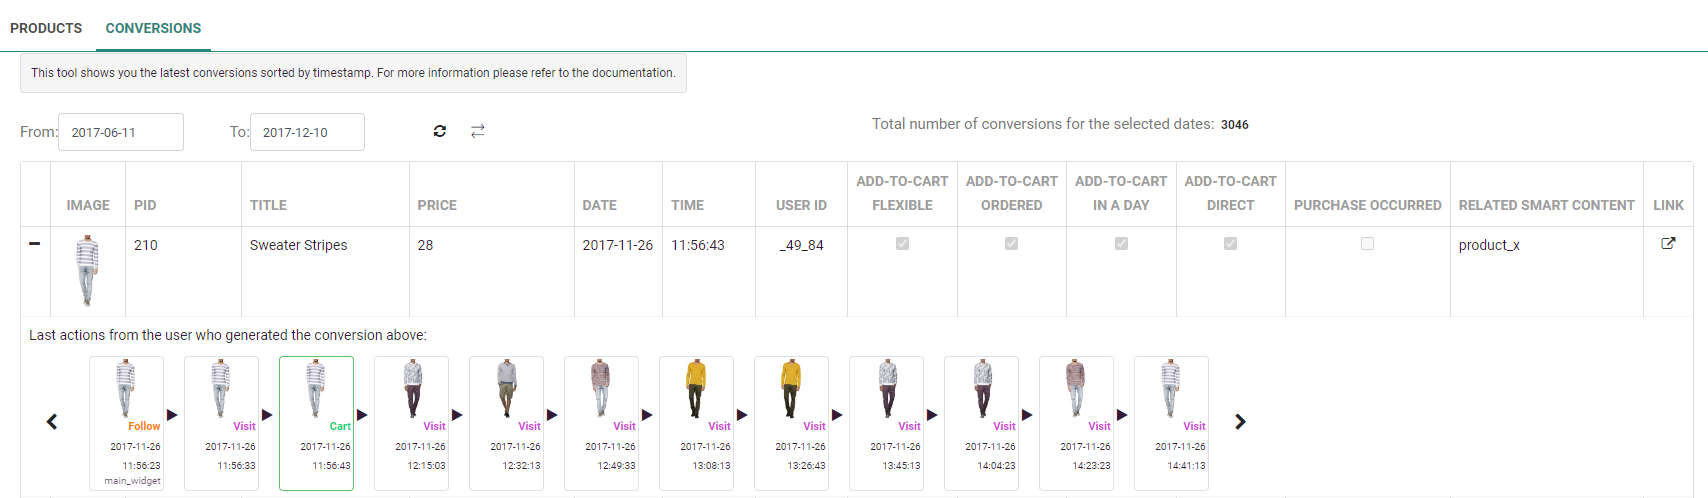
To help you better understand what conversions means, different types were defined, that correspond to the checkboxes you see:
- Flexible — A specific user has clicked on a specific item inside a recommendation and has added the same item to their shopping cart or purchased it. The order of actions is not taken into account.
- Ordered — Same as 'Flexible', but the "click on recommendation" action has to come before the "add-to-cart" or "purchase" action.
- In a day — Same as 'Ordered'. In addition, the two actions must be done in the same 24 hours.
For example :
- A user clicks on a recommendation of 'item A' on Monday at 9 am.
- They only add 'item A' to their cart or purchase it on Tuesday at 10 am.
- Because they only returned to your website on Tuesday when the 24h period ended to make the purchase, the conversion will not be counted as an "In a day" recommendation. - Direct — Same as 'In a day'. In addition, the two actions have to be consecutive.
For example :
- A user clicks on a recommendation of 'item A', visits the product page of 'item A', then visits 'item B', then adds 'item A' to the cart or purchases it.
- The conversion of 'item A' will not be counted as "Direct". These 'Direct' conversions are the ones that represent the most impulsive effect a Smart Content can have on a visitor.
Exporting the data
The conversion data can be exported by clicking on the Export button, located to the right of the date range and refresh buttons, at the top of the page.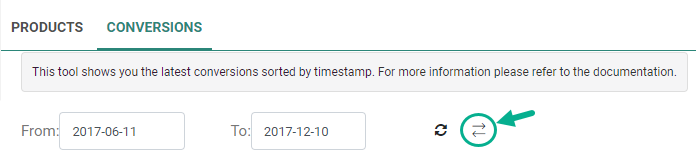
After you click on the button, a confirmation screen will appear. Click on "OK", and a file export in XLS format will be generated:

This file gives you the same information as what you have on the page with totals of cart value and conversion counts for each type of conversion described above. Moreover, the ID of the Smart Content that triggered the conversion is exported too. It's generally used to calculate the impact and ROI of Recommendations, as well as correlate this data with other sources in pivot tables.
