Recommendations monitors a number of key performance indicators (KPIs) for you. All of them are available in the form of graphs in the 'Performance' section of Recommendations. These metrics are automatically collected by Recommendations, and the graphs are usually updated daily.
There are two sub-sections, also shown as tabs :
Smart Content
The performance of your Smart Content is monitored over time, so that you can see if any changes you made on your site or Smart Content configuration affected performance positively or negatively. You can monitor the performance either collectively (all Smart Content at once), or individually (one graph per Smart Content). The performance can also be displayed as raw numbers, or as ratios.
Performance monitoring
Performance can be monitored either using raw numbers, or ratios. The first graph in the performance section of the dashboard monitors the metrics of all Smart Content collectively. The remaining graphs monitor the metrics of individual Smart Content.
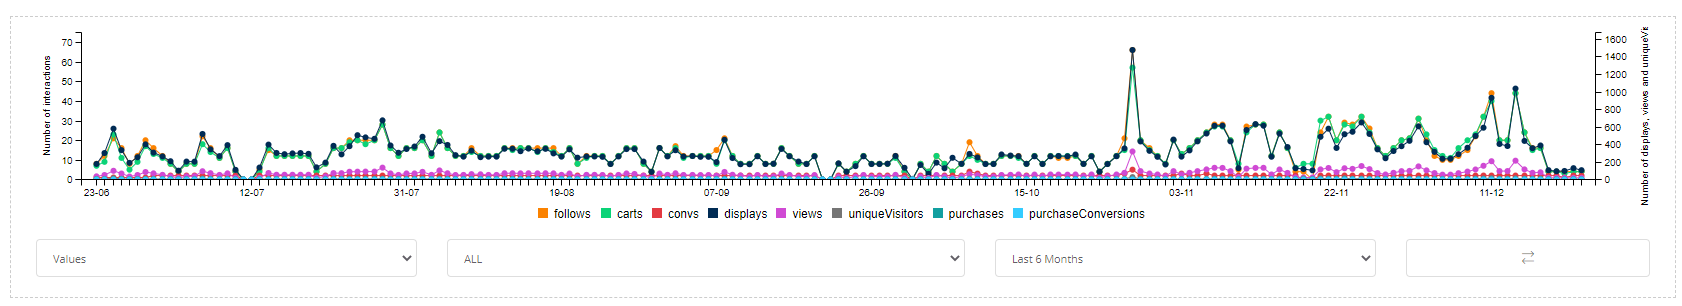
For each graph, there is a menu at the bottom resembling this:

The left-most drop-down menu lets you choose between:
- Values: This displays "raw" numbers in the graph, such as the number of times the Smart Content has been displayed.
- Ratios: This displays ratios of the raw numbers you see in "Values" mode. For example, the number of clicks on a Smart Content divided by the number of times the Smart Content has been displayed. This is a useful metric because it can be interpreted as the "click rate" of the Smart Content.
- Per User Ratios: This is only possible for the first (collective) performance graph. It displays metrics such as the mean number of page views per visitor on your site.
The second drop-down menu displays the name of the Smart Content, whose metrics are currently being displayed, or "ALL" for the top-most collective performance graph.
The third drop-down menu lets you choose a time period over which you would like to display performance metrics. Options ranging from the last three days to the last two years are available.
The button at the very right lets you export the data you are currently looking at into MS-Excel format.
Value Mode
The values monitored are the following:
- follows — The number of times visitors followed (clicked on) a recommendation inside a Smart Content. For specific Smart Content, this refers to how often that Smart Content has been clicked on. For the collective performance graph, this refers to clicks on all Smart Content.
- conversions — The number of add-to-carts attributable to Smart Content. We consider a conversion to happen when a visitor clicks on a recommended product inside Smart Content, and then adds the same product to their cart. For specific Smart Content, this refers to the conversions attributable to that Smart Content. For the collective performance graph, this refers to clicks on all Smart Content.
- displays — The number of times the Smart Content has been displayed. If a page contains two Smart Content blocks, displaying this page will cause one "page view", and two "displays". For specific Smart Content, this refers to how often that Smart Content has been displayed. For the collective performance graph, this refers to how often all Smart Content blocks were displayed.
- product page views — The number of product pages that have been displayed. Only available for the collective performance graph.
- carts — The number of times visitors added a product to their cart (number of add-to-carts). Only available for the collective performance graph.
- unique visitors — The number of unique visitors your site received. Only available for the collective performance graph.
- purchases — The number of purchases that are imported.
- purchase conversions — When the item is viewed, followed or added to a cart and then purchased at a later time, it’s considered a “purchase conversion”. The time range for a conversion is within 5 days after the interaction.
Not all values are displayed in all graphs. The graphs for a single Smart Content monitor only the displays, follows, conversions and purchase conversions:

This is because the "views", "unique visitors", "purchases" and "carts" are values that are global site metrics, and are not directly related to specific Smart Content. The collective performance graph monitors all values. Notice that the legend just below the graph ("displays, follows, convs, purchaseConversions" in the example above) is clickable. If a certain value does not appear in the graph, try clicking on the value you would like to see.
Ratio Mode
The metrics monitored are the following:
- PageView attribution (% page views attributed to Smart Content) — The number of clicks on Smart Content, divided by the number of product page views, expressed as a percentage. For specific Smart Content, the number of clicks refers to the clicks for that Smart Content, but the number of (product page) views refers to all views on your site. For specific Smart Content, this can be interpreted as the percentage of all product page views that are directly attributable to that Smart Content. For the collective performance graph, it's the percentage of all product page views attributable to all Smart Content.
- Cart attribution (% carts attributed to Smart Content) — The number of conversions (add-to-carts attributable to Recommendations) divided by the total number of add-to-carts. For specific Smart Content, the number of conversions refers to the conversions attributable to that Smart Content. The number of carts refers to the carts on the whole site. This can be interpreted as the percentage of all add-to-carts on your site which are attributable to that Smart Content. For the collective performance graph, it's the percentage of all add-to-carts on your site attributable to all Smart Content.
- Purchase attribution (% purchases attributed to Smart Content) — The number of purchases attributed to the Smart Content divided by the total number of purchases. For specific Smart Content, the number of purchases refers to the purchases attributable to that specific Smart Content. This can be interpreted as the percentage of all purchases on your website that are attributable to this specific Smart Content.
The same graph as in monitoring performance 'values', this time expressed as 'ratios', looks like this :
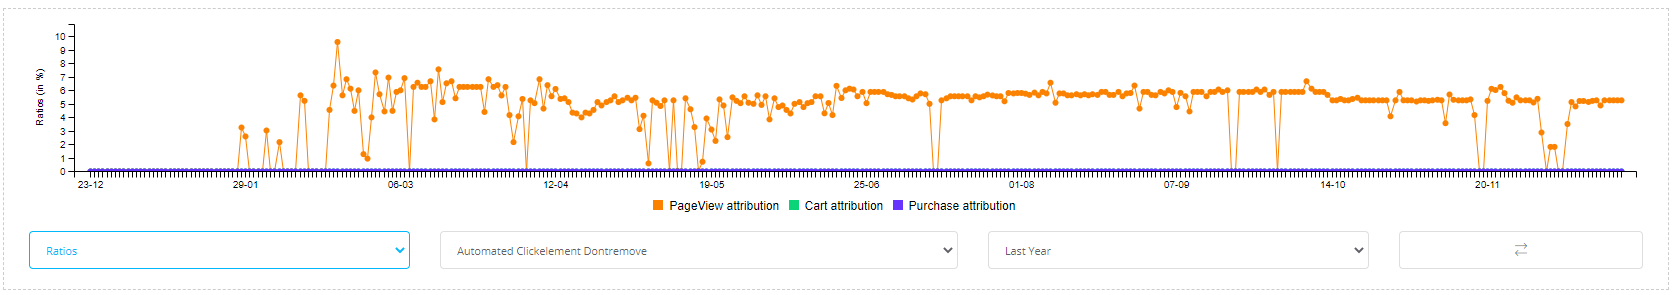
The % page views attributed to Smart Content is a "discovery metric": the higher the numbers in this graph, the higher the responsibility of Smart Content is for making your visitors discover product pages.
The % carts attributed to Smart Content metric is a "performance metric": The higher this number, the more Smart Content is responsible for add-to-carts.
Note: Cart/purchase attribution refers to cart and purchase events in the online tracking, as defined in the JS tracking.
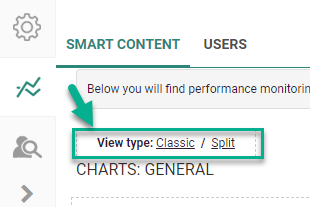
At the top of the screen, you can change the view type of the graphs :
-
Classic — each graph is stretched over the total width of the page.
-
Split — shows the graphs in 2 columns.
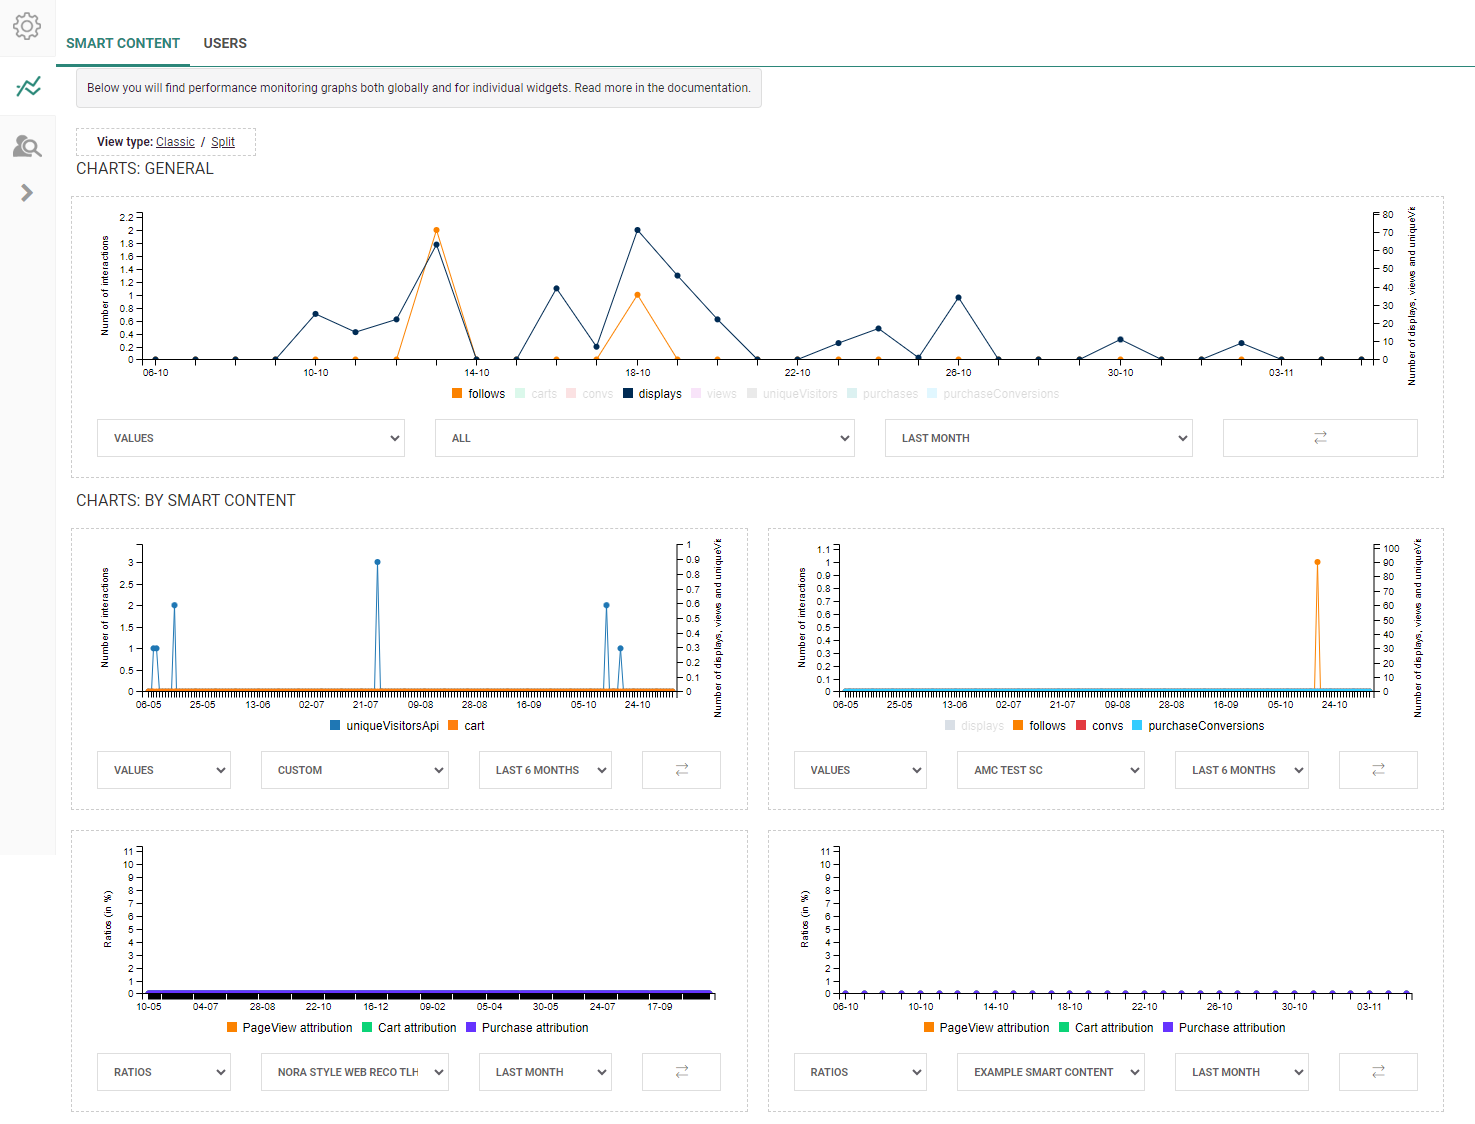
You can add new graphs by clicking on the '+' sign in the placeholder block that appears at the bottom of the page.
Example screen with different graphs :
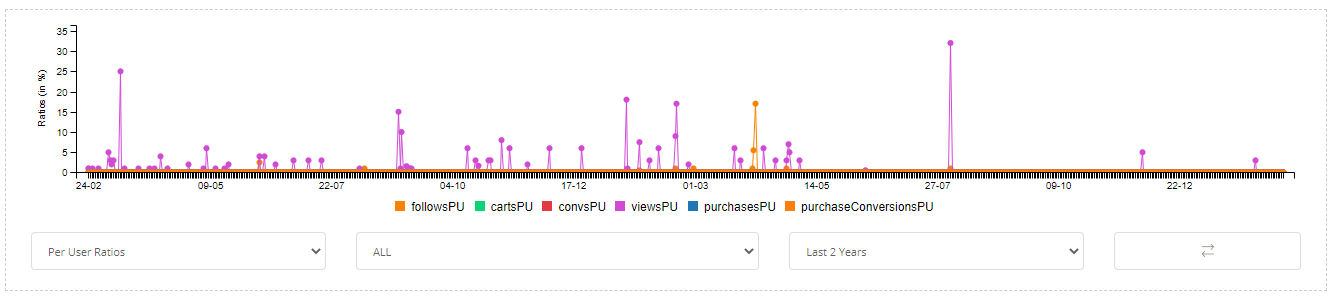
Per User Ratios Mode
For the collective performance graph, a third option, "Per User Ratios" is available. The metrics being monitored are:
- Follows per user — The average number of follows per visitor on your site.
- Carts per user — The average number of add-to-carts per visitor on your site.
- Conversions per user — The average number of conversions per visitor on your site.
- Views per user —The average number of (product page) views per visitor on your site.
- Purchases per user — The average number of purchases per visitor on your site.
- Purchase conversions per user — The average number of purchase conversions per visitor on your site.
Users
The 'Users' page allows to analyze two different groups of users :
- those who click on Smart Content recommendations
- those who don't click on Smart Content recommendations
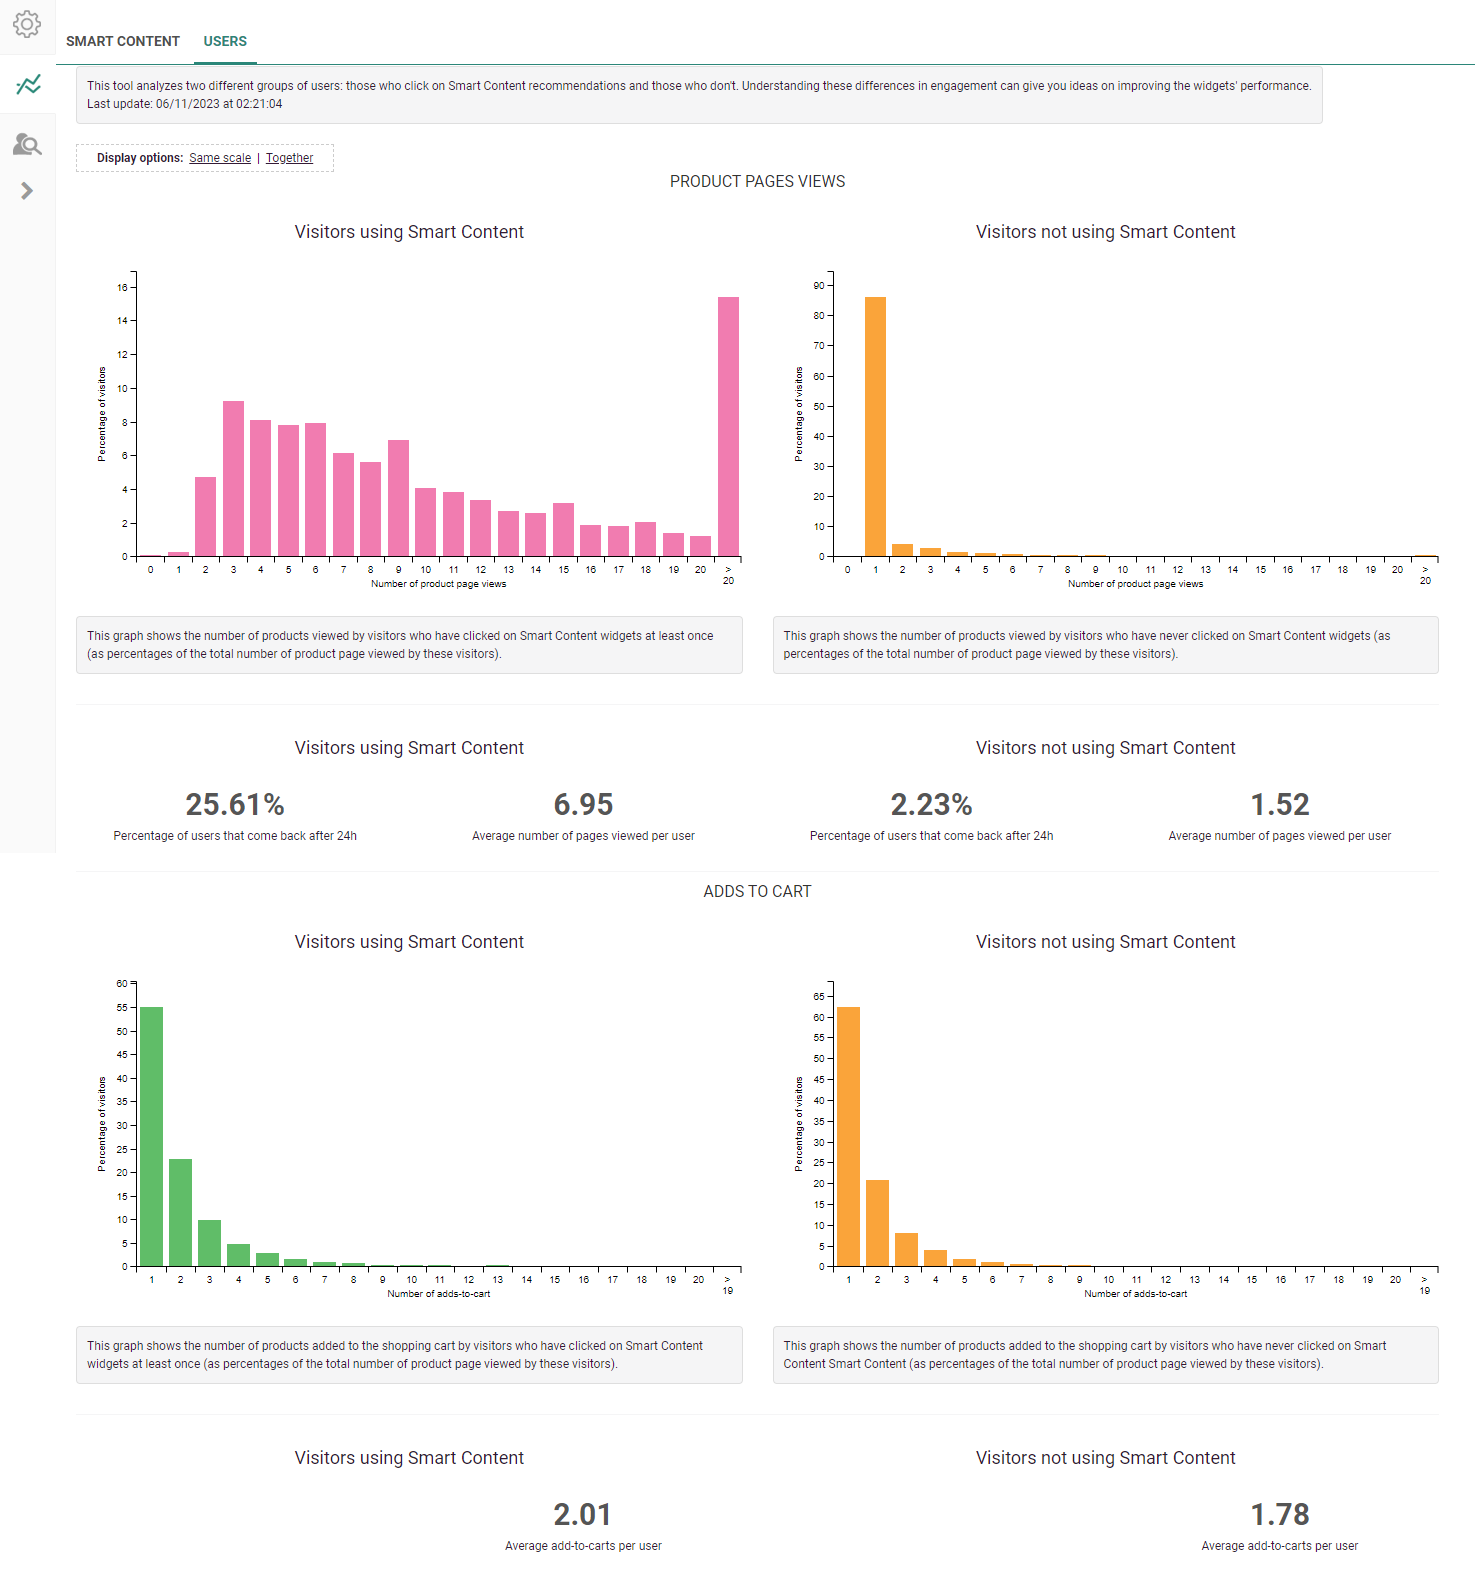
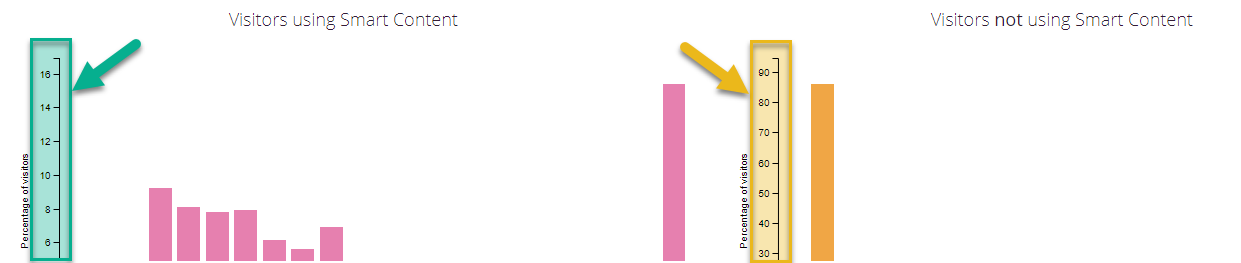
The different graphs and values shown are for visitors using Smart Content (clicked on Smart Content widgets at least once) versus NOT using Smart Content (no Smart Content clicks at all) :
- Product page views :
- Number of product page views
- Percentage of users that come back after 24h
- Average number of pages viewed per user
- Adds to cart :
- Number of adds-to-cart
- Average add-to-carts per user
At the top of the screen, you can change the display options of the graphs :
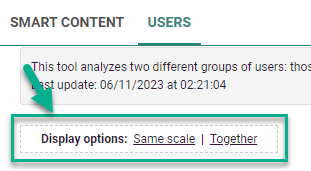
-
With the left option, you can choose adjusted or same scale.
- 'Adjusted' shows each graph with their own applicable percentage values (= Y-axis) :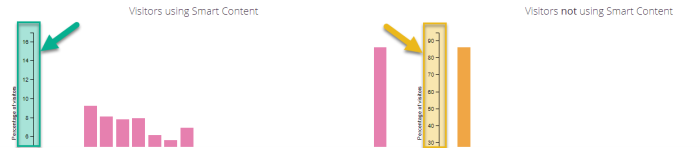
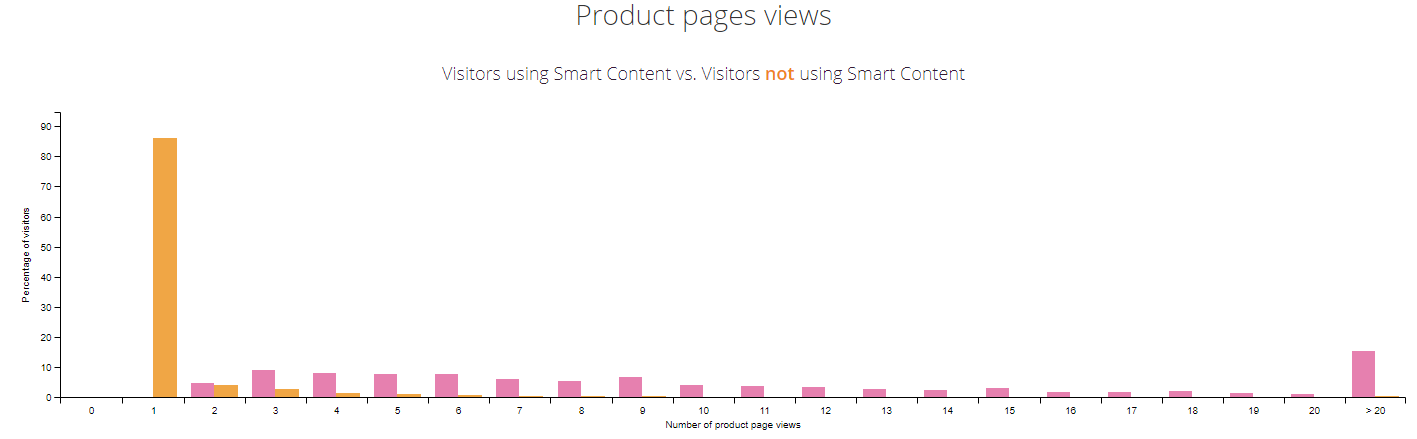
- 'Same scale' uses the same percentage values (= Y-axis) for each graph :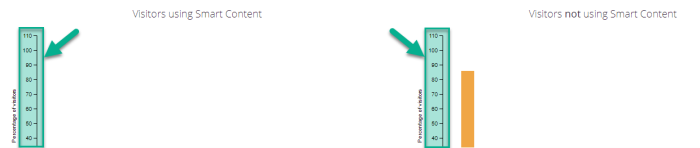
-
With the right option, you can choose separate or together.
- 'Separate' shows two different graphs each time; one for visitors using Smart Content and the other for visitors NOT using Smart Content :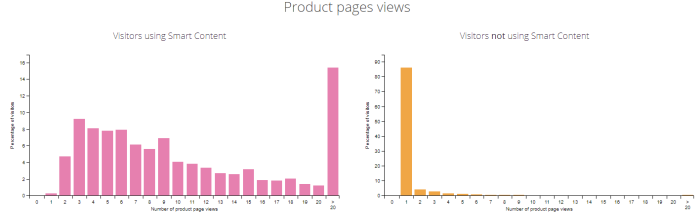
- 'Together' shows one combined graph each time, containing both the statistics for visitors using Smart Content and for visitors NOT using Smart Content (each with their own distinguished color though) :