Dashboard
The Dashboard is composed of three main sections
At first connection to the Site tool the dashboard is slightly different. It welcomes the user, presents use cases when available and informs to user on the steps to take to get started. When the user creates a new universe, the Dashboard informs him about the next steps.
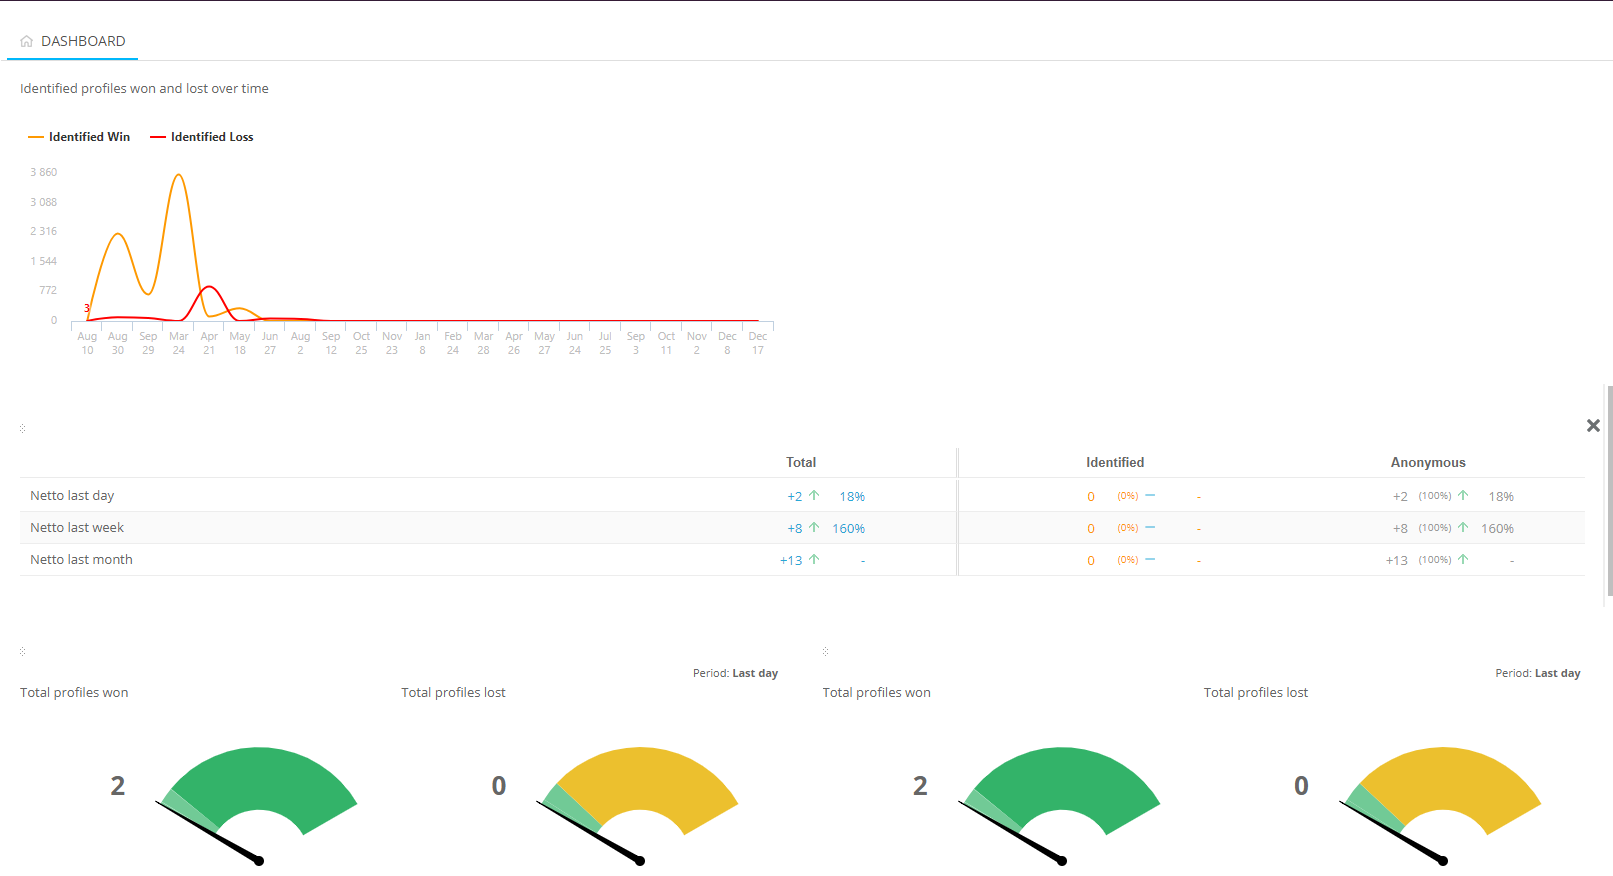
Your pinned reports are displayed in the center of the dashboard. If no reports are pinned yet, only a message is displayed informing the user how to pin reports.
Monitoring information: displayed at the bottom. If no reports are available yet on the dashboard, the monitoring information is by default expanded. If there already reports, this monitoring information is collapsed and can be viewed by scrolling down.
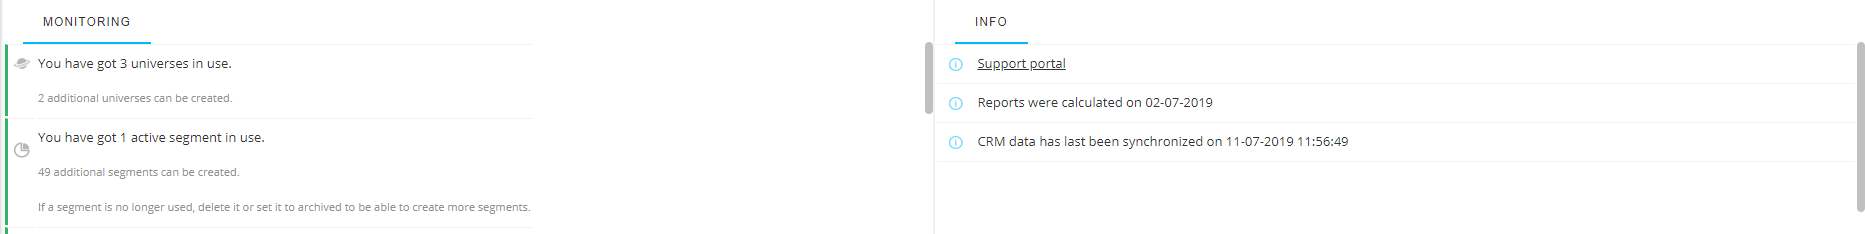
Typically you'll find here information on:
- The Site environment: is the environment correctly configured, how many universes, Reporting segments, tags or offers can still be configured. A red band indicates an error, yellow a warning and green general information.
- Release dates and numbers
- Links to the support portal (ticketing system), Marigold Community and Site manuals
- The last reporting update date (reporting is calculated once a day, except for ‘Real-time view’)
- Information on the last sync with CRM
The content of the dashboard is completely configurable. From all reports in the Site tool, the user can select the ones he is interested in and pin these to the Dashboard.
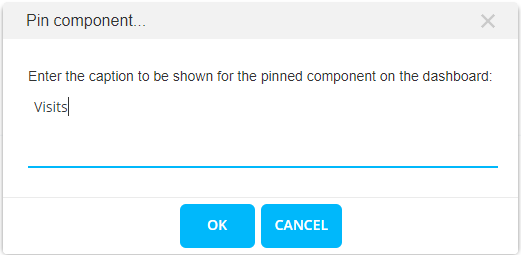
To add a report to the dashboard, click the pin buttonin the right-top corner of a report or right click the report and select 'Pin component'.
A pop-in message informs the user the report has been added successfully:

When holding down de ALT button and clicking the pin button on a report, a new title can be entered for this component on the Dashboard while at the same time pinning it to the Dashboard.
Dashboard reports can be resized. Hoover over the right edge of the report. A grey line appears. Drag this line to the left or right to change the size.
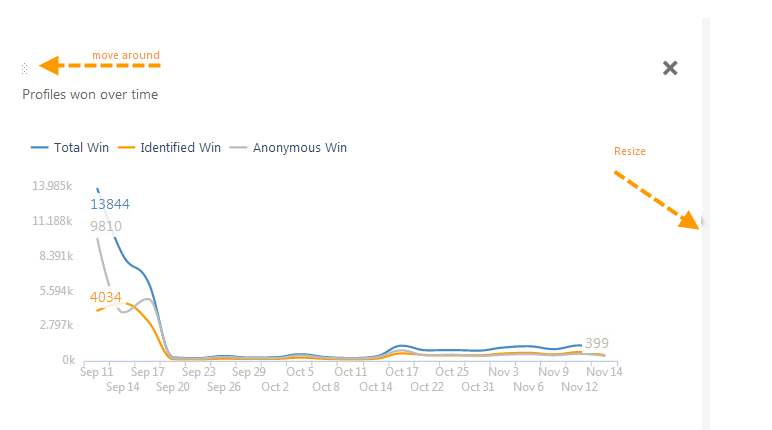
To change the position of a report, use the dots in the upper left corner of the report element. Drag and drop to a new position.
Right click a report to change the title.
