Real Time View
- Visit and hits numbers and graphs.
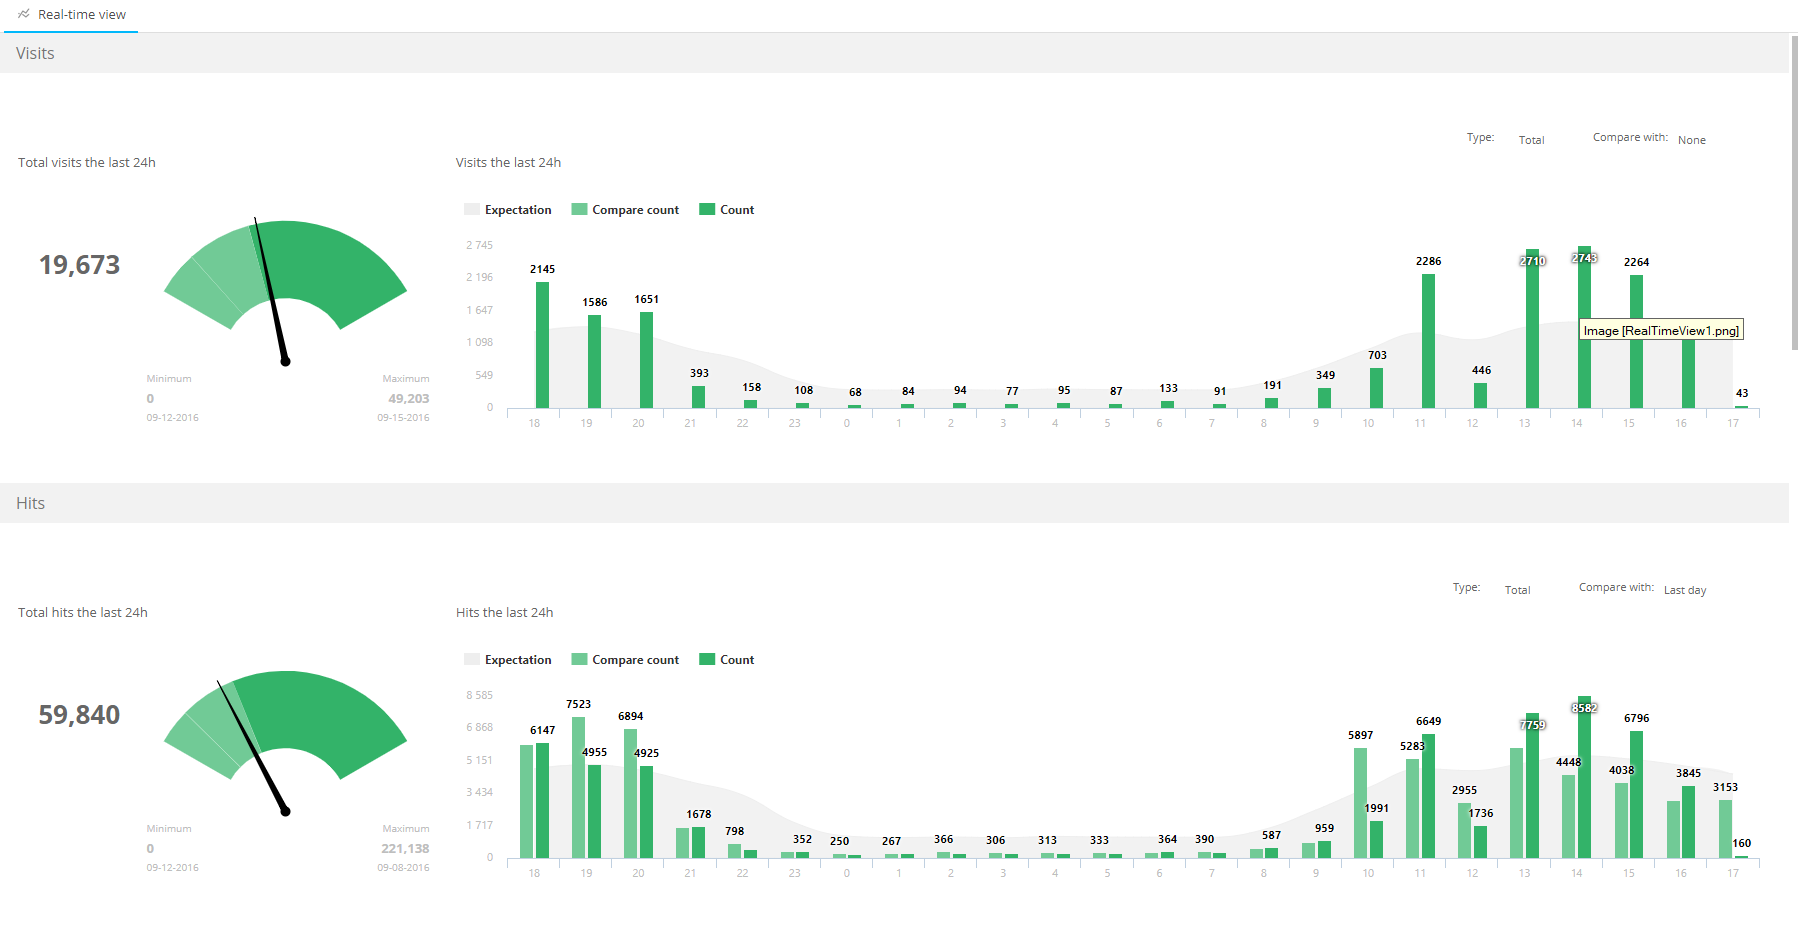
Numbers of the last 24hours can be compared with numbers of the previous day, last week, last month, etc. Use the field 'Compare with' in the upper right corner.
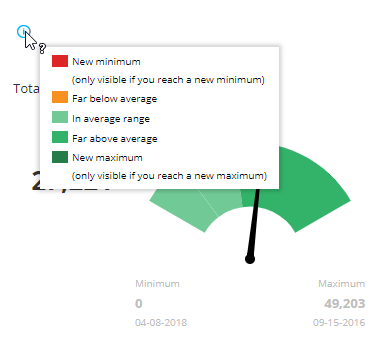
Minima and maxima values are provided together with the date on which these amounts were achieved. Hover the 'i' for details on the color code used for the gauges.
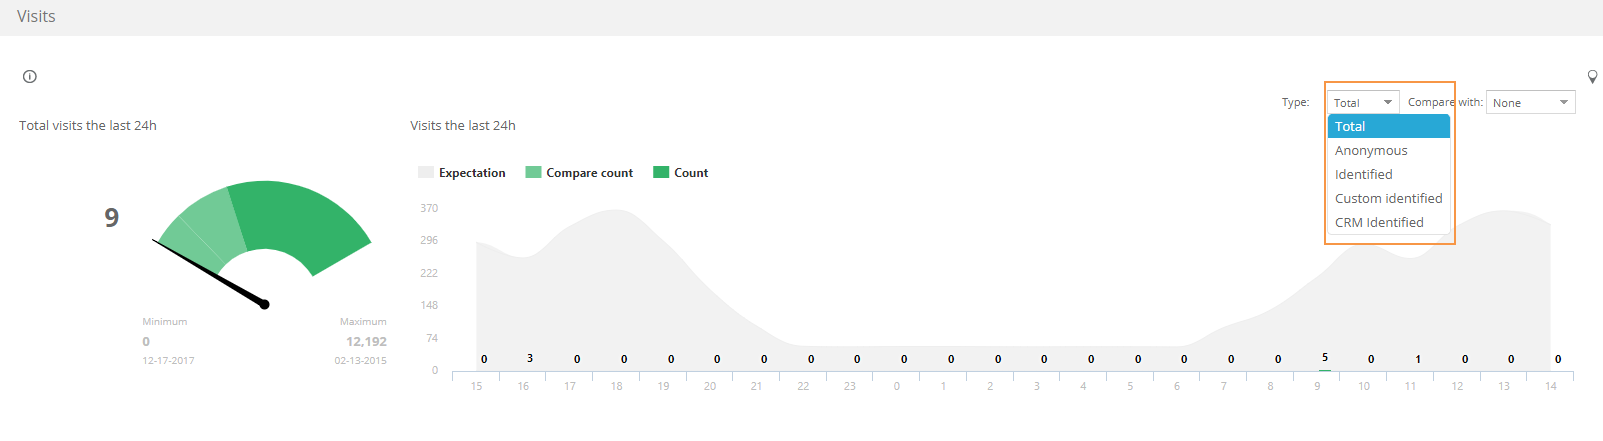
In the upper right corner of the graph, a 'Type' fields filters the information by anonymous, identified, custom identified or CRM identified
Zoom in on a specific time range by dragging over it.
The average and expectation curves are based on all data from the past.
- Tags
The trend for a specific tag. Lists the score of the different values for the last 24 hours.
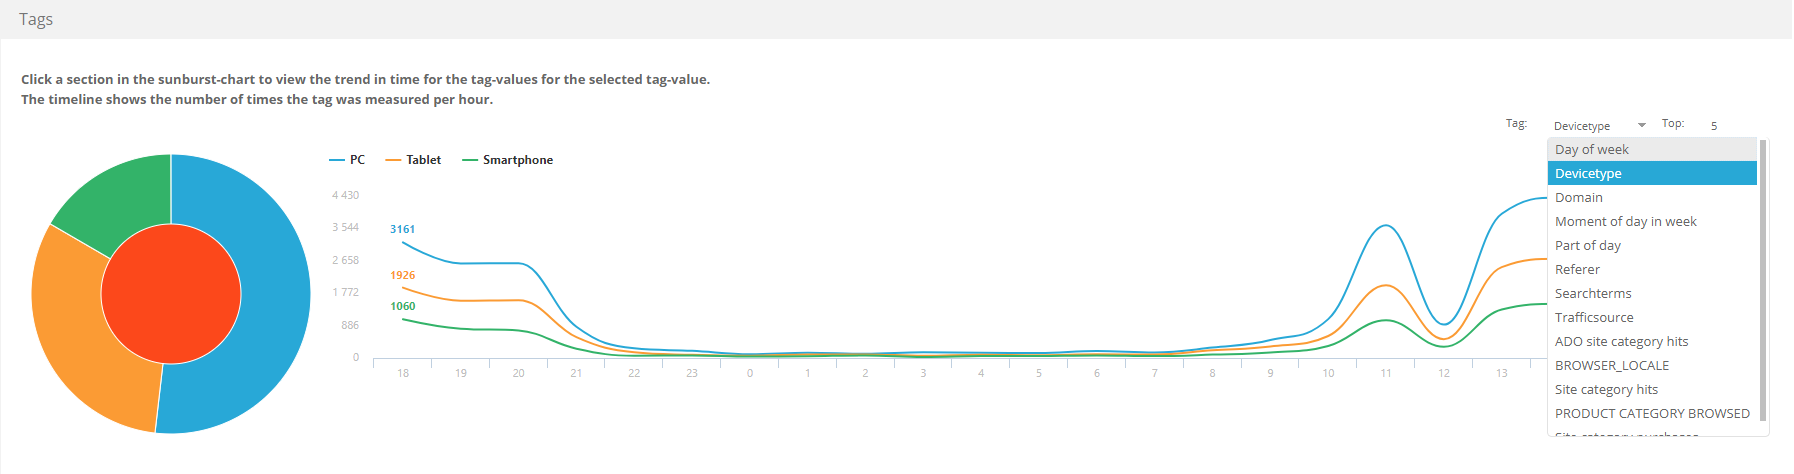
Select a tag from the 'Tag' field in the upper right corner. Use the 'Top' field to limit the tag values.
For hierarchical tags, select a level from the multi-level pie graph. It displays the values for that level. (e.g. For a tag “Site category” the MAINCATEGORY displays “Electro” and “Fashion, while the “Fashion” SUBCATEGORY displays “Fashion_men”, “Fashion_women” and “Fashion_children”)
- Offers
The number of times a specific offer and its actions has been viewed, clicked and led to conversion.
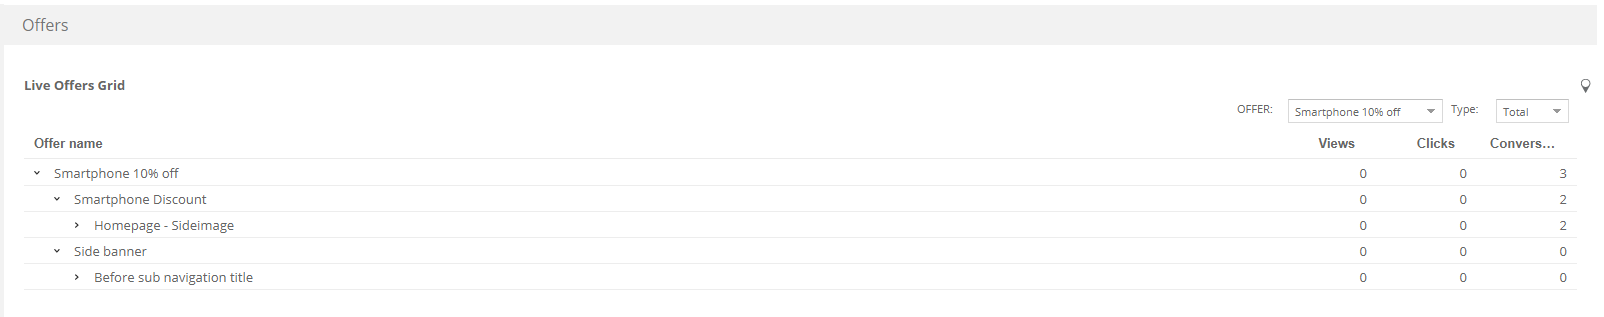
Select an offer from the drop down in the upper right corner.
Use the'Type'field to filter by anonymous, identified, custom identified or CRM identified profiles.
Note: “Non-tracked” visitors are considered as anonymous visitors (each action done by a consentless visitor will be considered as a new anonymous visitor).
