Journey Execution times and audience size are provided in this report for the last two months. The report is available for all journeys and for a single journey.
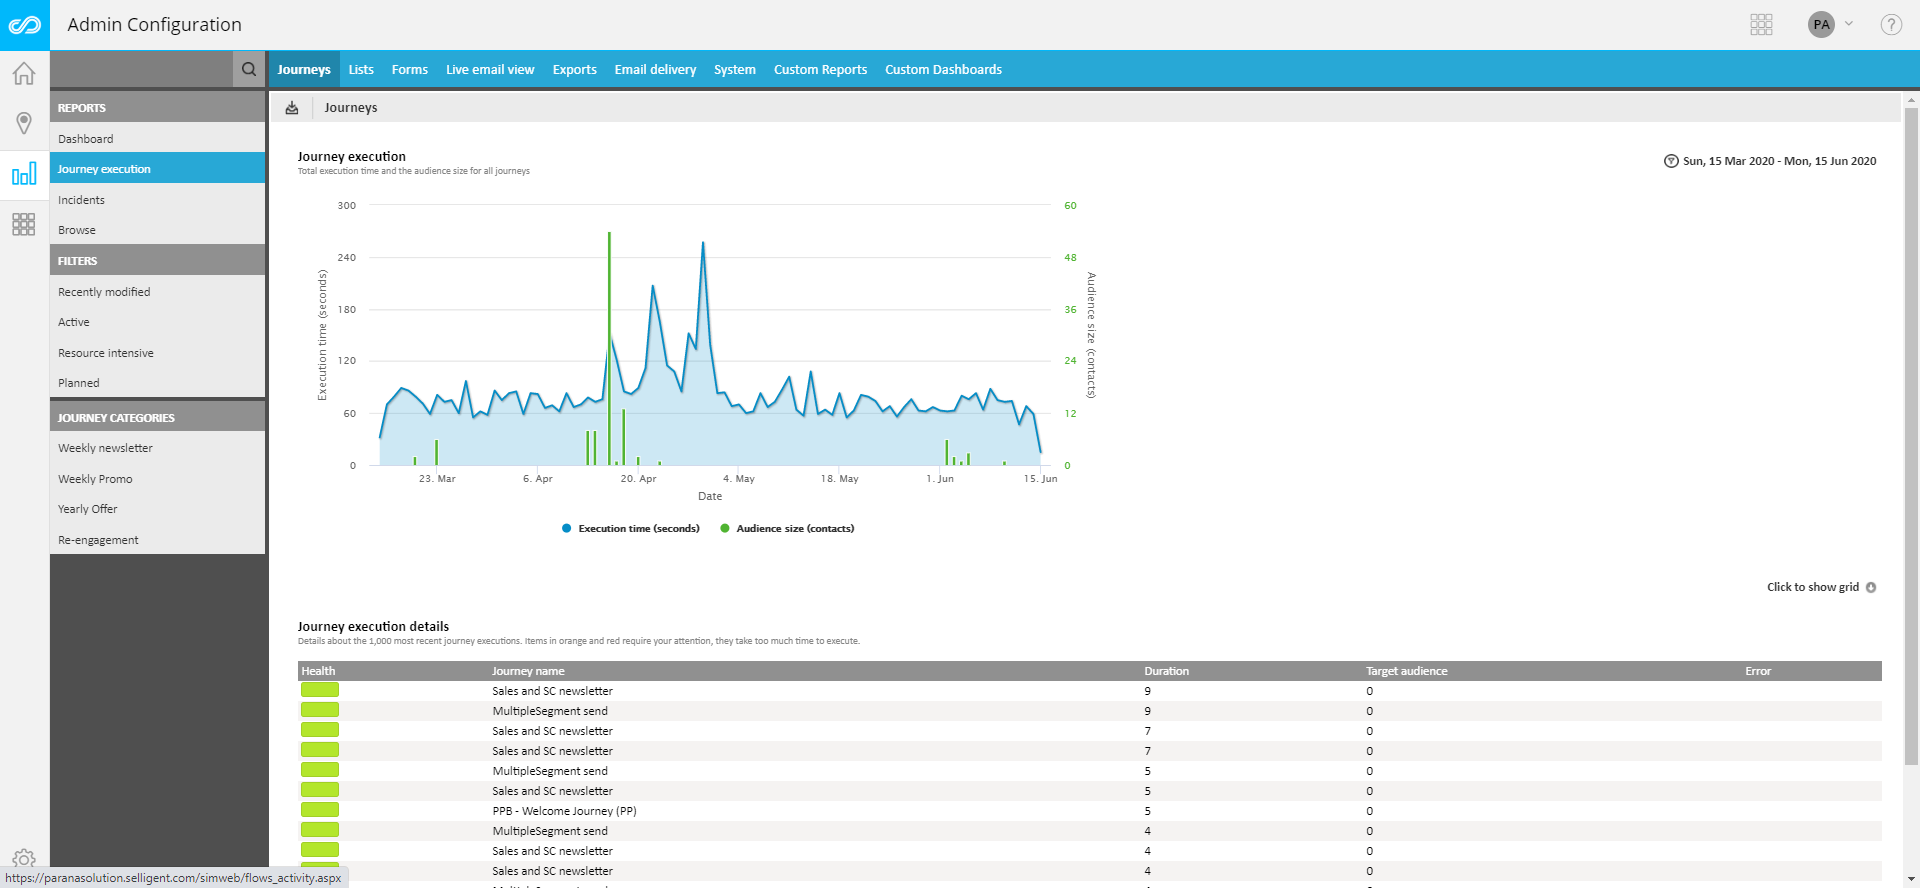
Standard chart and graph options are available. The chart lists journeys according their execution times, with the slowest at the top. The chart applies a color code. Red and orange require attention as execution times are too high.
If a journey is executed multiple times, it will be listed as many times in this chart.
