The Report component generates reports about the target audience at any given location in the Journey.
No limit is imposed on the usage of Report components in a Journey. In addition, they can be inserted at any location. A fine example that shows the benefits of the Report component is to select a winner in a contest scenario. Instead of analyzing the total Journey results, a Report component can be inserted after a Decision component, selecting the winners. In this manner, only the winners will be displayed in the report. The report can be exported to text, csv-file or Excel.
Now report components show directly, in the journey the number of contacts that are currently at that step in the report. These numbers are calculated asynchronously, meaning that the user can continue to work in the journey or even close the journey. The calculations will continue. Calculations can be launched for each report component individually or for all at once.
When report components are added to a journey an additional icon is added to the toolbar that allows launching these calculations:  . There are two options here:
- Calculate: starts calculating counts for all report components in the journey
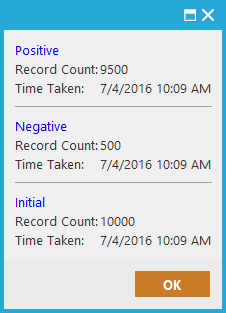
- Overview: opens a popup with an overview of all the counts for all report components in the journey and the date time at which the count was finished.
The report component itself can have different states.
 : While the calculations are still ongoing a processing indication is added to the report icon.
 : When no count is available or the count was no longer valid (after changes in the journey)
 : The count is up to date and the number is indicated as well
Note: when something changes in the journey before the report component (e.g., audience target change, changes in the settings of control groups, AB test components, split components, etc) that might have an impact on the counts in the report components, counts are removed from the report component to avoid displaying inaccurate numbers. The ? state of the report component is shown in this case.
Report specific functionality: View
Right-clicking the Report component and select 'Report'. This function allows examining the report content and displays the selection of contacts at that place in the journey.
Two tabs are available: Data and Drill.
DataTab:
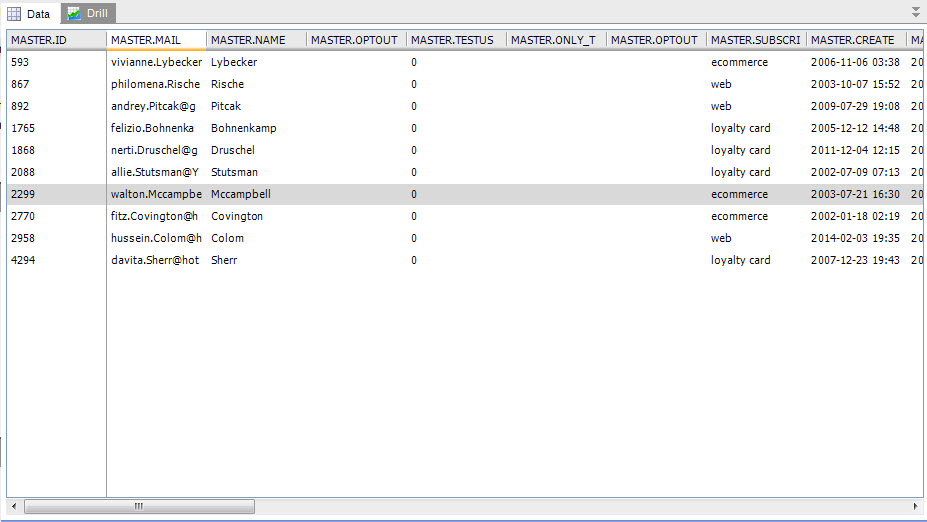
The 'Data' tab gives an overview of all contacts in the report. By default only the first 10 contacts in the report are shown. To see more contacts, click the drop down next to 'Limit results' and choose another value (100, 1000, 10000). The total amount of contacts in the report is shown in the status bar, in the bottom-right corner. 'Show optouts' will also list all contacts that are in the selection but have opted out (OPTOUT > 0) and will never receive the email.
By default all columns in the Audience list are displayed in the overview. To limit the attributes displayed to the ones that are useful for the report, press the ‘Columns’ icon in the toolbar to access the configuration pane and configure the content of the report.
1. Select the field in the navigator that must be added to the report and click 'Add Field'. Do this for all the fields you want to see in the report
2. Click the 'Add Formula' button to add a SQL expression.
3. Click the 'Add constant' button to add a constant.
4. Click the 'Refresh' button of the view-dialog to see the changes.
5. The buttons at the bottom are used move fields up and down.
Additionally following options are available as well:
- Translate: when a translation (option list) exists for a field value it is possible to use this translated value instead of the value stored in the database
- Explode: created for fields containing the result of a matrix component (Form), its content is a list of all choices done by the contact (multi value fields). All choices are “pipe or comma separated” and in order to retrieve each value separately the'Explode'button has been introduced. Using the button on a multi value field ” will split the field content and add one column per choice in the report.
The report with its chosen columns can be exported to text, csv-file or Excel. Click the 'Export' button to create the export.
DrillTab:
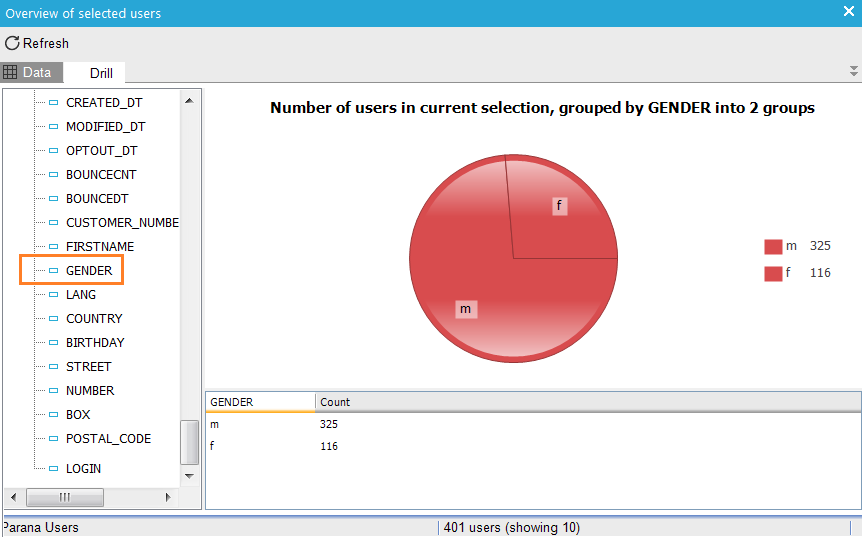
The 'Drill' tab gives a graphical overview of the data in the report. It groups contacts based on the different values in a field. The tree view on the left is used to adapt the graph on the right according to the selected column.
Example: To check if you selected only the men, you can drill by the GENDER field if the audience list. It displays the distribution of the contacts based on all the gender values in the field. Clearly, in this example the selection does not only contain the men, but also 116 women.
NOTE: attributes can be selected from the Master list as well from the linked data lists.
Events
The Report component generates no events.
Properties
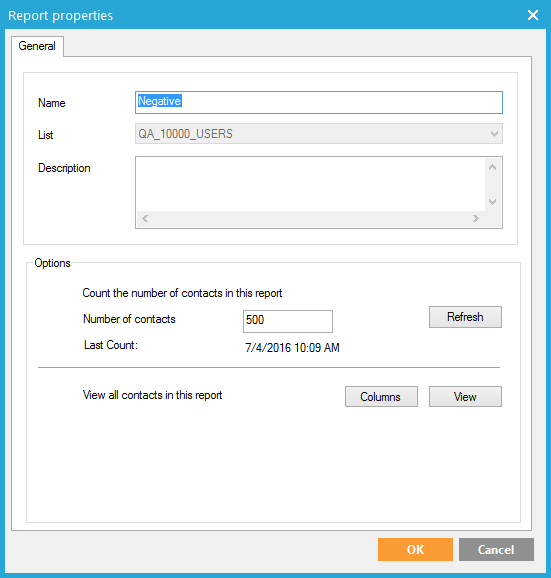
1. Enter a name for the report in the Name field. Give the report a proper name. The report will also be visible in the online reporting as a ‘checkpoint’
2. When desired, describe your report in the description text field.
3. Select the Audience on which the report will be based from the list drop down. If only one audience is used in the Journey, no Audience list has to be selected and the Report component is connected in the Journey, this field will be pre-filled.
4. Click OK to finish.
The button ‘Refresh’ calculates the number of contacts currently in this report. The date and time of the last calculation is indicated here.
The buttons ‘View’ and ‘Columns’ display the same information as when selecting the option ‘Report’ from the pop-up menu after right-clicking the component.
How to interpret audience counts in Campaign and in Communications Cadence.
