Selligent Form provides a detailed report available when clicking the'Report'button in the toolbar. The survey's report is also available on the portal. Unlike the reporting in the portal, on the right side, you can select a subset of contacts to view the reports. E.g. Everyone that completed the survey, or answered "yes" on a certain question... Include or exclude segments from the audience list or create your own filter with the filter designer.
The report can be exported to a PDF file from the top menu bar.
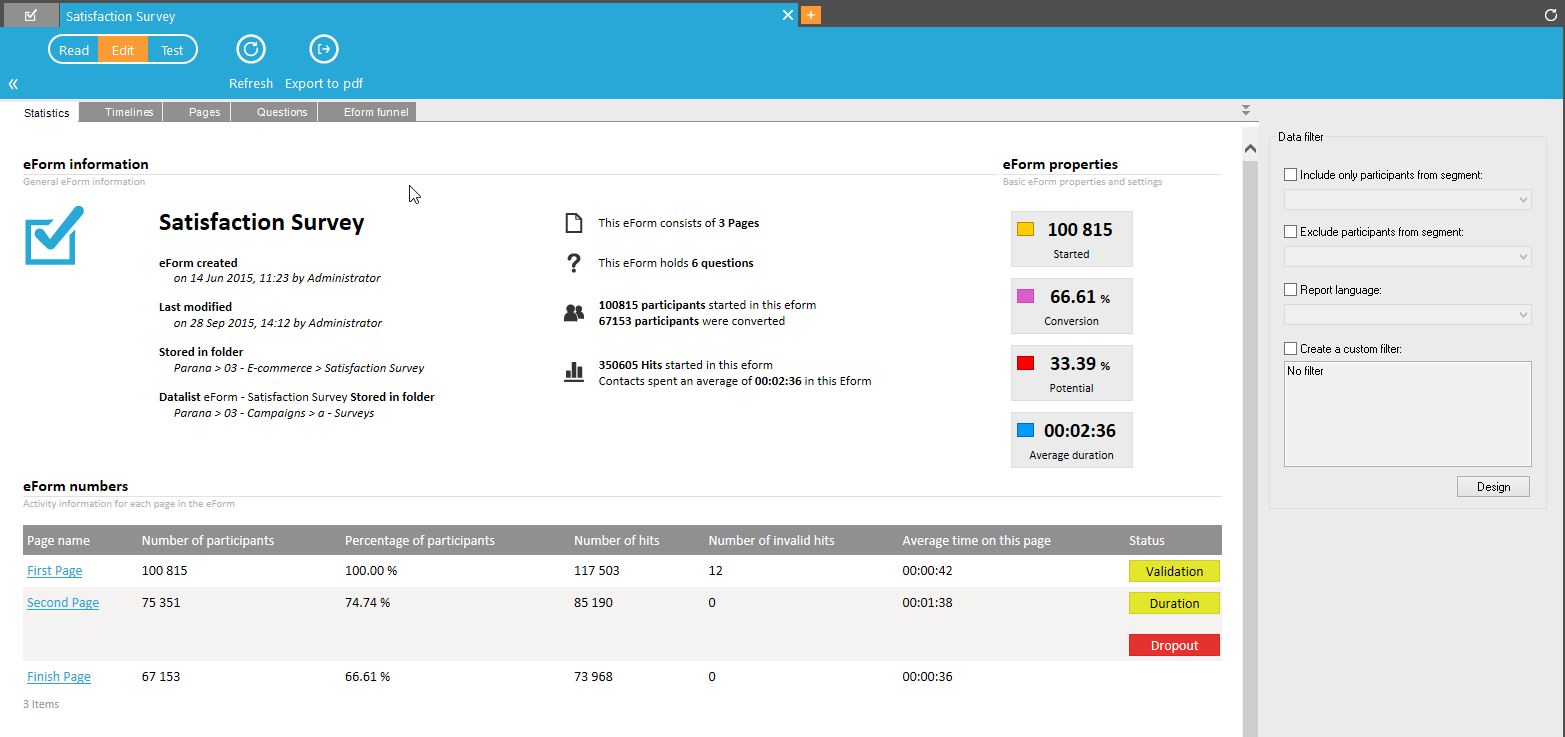
Statistics
General information about the survey: number of participants, number of hits, average time on a page, activity over time,…
The 'Form numbers' report provides useful information on how long someone stays on a page. If your 'dropout' page is before the finish page you might consider altering the questions or structure on the dropout page. Or if the average duration is too long you might want to change some questions on that page.
Time lines
An overview of the form activity over time (last 24h, last 30 days) and the average distribution per hour and per weekday.
Questions
An overview of the answers per question. The charts types (bar, pie...) displayed here depend on each question's 'Reporting options' tab settings.
Form funnel
An overview of the number of persons that participated on each page to see the dropout rate of the form.
