Why do the Reporting tab and Marigold Engage Dashboard show different values (for sent, delivered, opened, clicked, ...)?
When comparing the data in Marigold Engage's Journey Reporting versus the Dashboard, when I filter down by month, the numbers don't match and seem to be way off. Why does this happen?
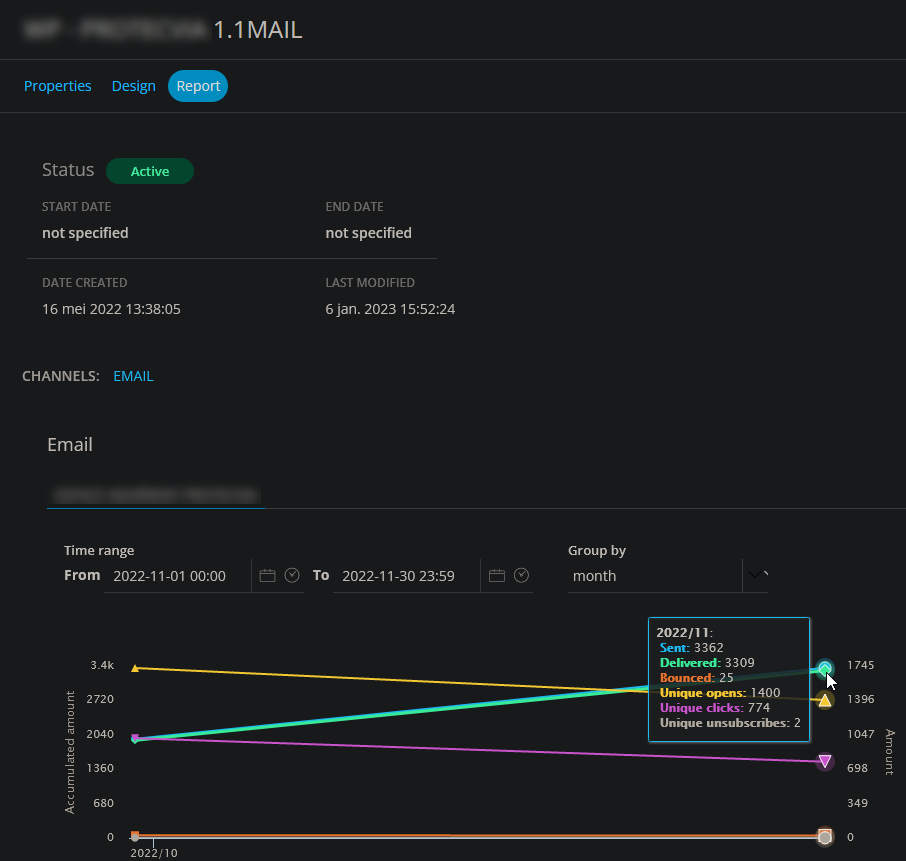
Journey report :
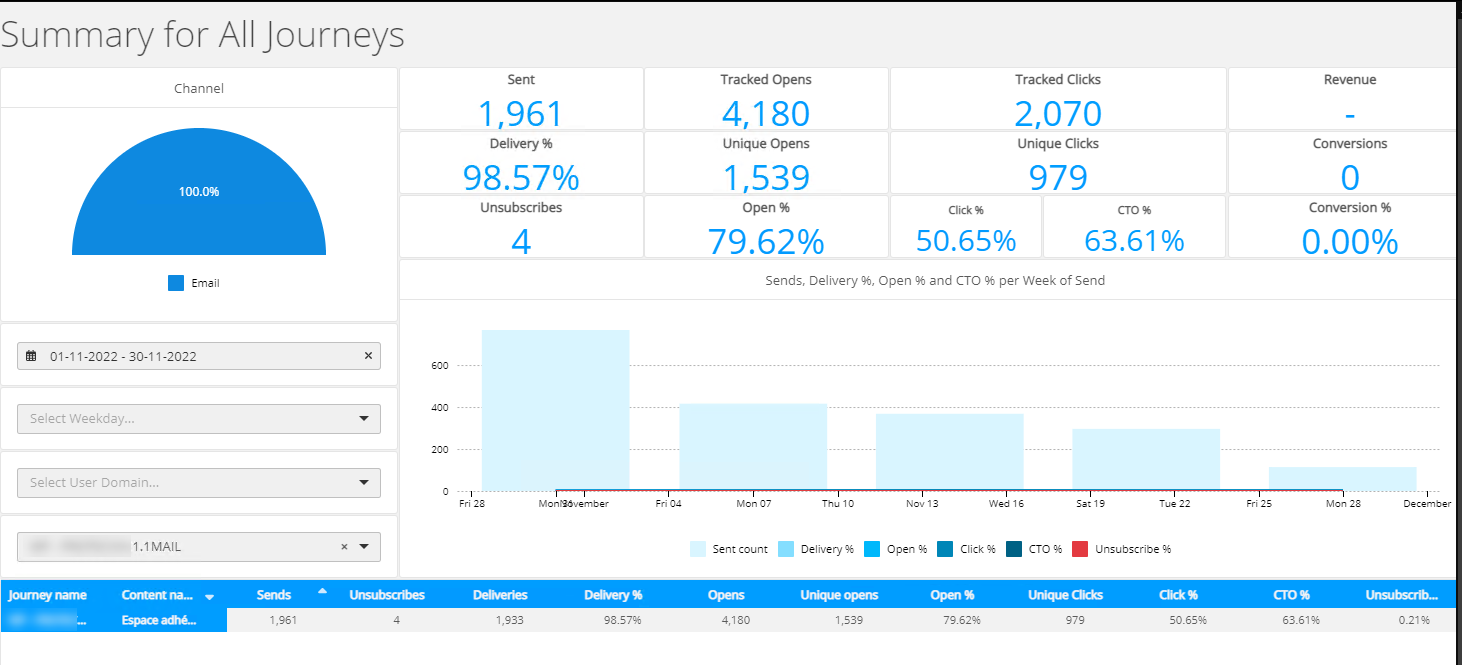
Dashboard :
Answer :
This is because of the way the check is performed on the date filter for the Reporting Tab and the Dashboard :
-
In the Reporting tab, the underlying query is done on the DT column in the INTERACTION table (date of the interaction).
-
In the Dashboard, the underlying query is done on the SENT_DATE column in the AGG_DAY_REP table. This date is the date of the communication (corresponds to the SENT_DT in the DELIVERIES table).
So, for example let's say an email was sent to contact X on October 30th, but contact X doesn't open or click on any of the links in the mail until November 3rd.
This will cause the email actions to be recorded as part of October's reporting in the Dashboard, but part of November's reporting in the Reporting tab.
Note:
If you want the numbers of the Dashboard and Reporting tab to be more in line, keep this in mind :
For the Dashboard, in the AGG_DAY_REP table, there are columns (eg. FIRST_CLICK_DT, LAST_CLICK_DT, FIRST_VIEW_DT, LAST_VIEW_DT) that have a better match with the DT of the INTERACTIONS table used for the Reporting tab.
